The USA500 is trading at 4,792.
US stocks edged higher on Wednesday, finishing largely flat and leaving the S&P 500 hovering just below its all-time closing high.
The benchmark index remains less than 1% away from its January 3, 2022, record close of 4,796.56, with the seasonal Santa Claus rally so far failing to produce a more decisive move.
Still, the S&P 500 is up 24% in 2023, rebounding from the 20% dive in 2022, and investors remain upbeat heading in the new year amid hopes for rate cuts from the Federal Reserve. Meanwhile, the Dow Jones Industrial Average has already set new record highs this month
USA500 Analysis
EU Session Analysis for CFD Instruments 28/12/2023
Technical analysis
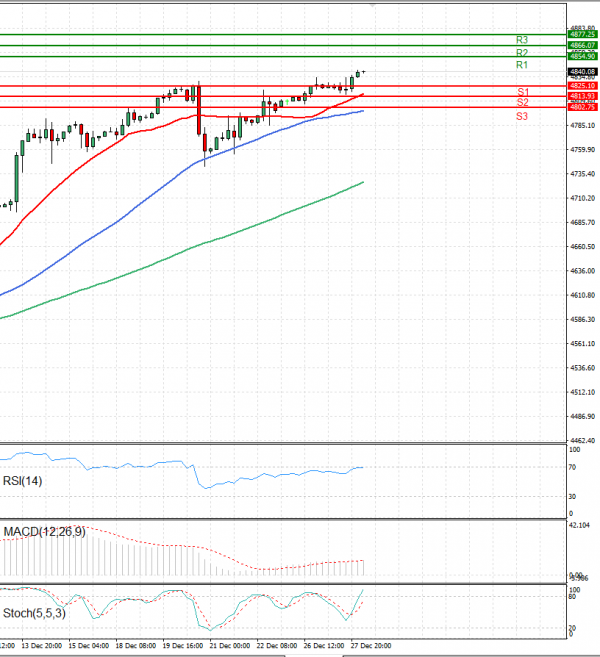
Time Frame: 1 hour
USA500 Support & Resistance Table - 28/12/2023
| Support & Resistance | Level | Explanation |
| Resistance 2 | 4866.07 | Daily R2 |
| Resistance 1 | 4854.90 | Daily R1 |
| Support 1 | 4825.10 | Daily S1 |
| Support 2 | 4813.93 | Daily S2 |
USA500 Indicator Table - 28/12/2023
| Indicator | Signal |
| SMA 20 | Buy |
| SMA 50 | Buy |
| SMA 100 | Buy |
| MACD( 12;26;9) | Buy |
| RSI (14) | Neutral |
| Stochastic ( 9;6;3) | Buy |
USA500 Indicator / Period Table - 28/12/2023
| Indicator / Period | Day - Buy | Week - Buy | Month - Buy |
| MACD( 12;26;9) | Buy | Buy | Buy |
| RSI (14) | Neutral | Buy | Buy |
| SMA 20 | Buy | Buy | Buy |
USA500 28/12/2023 - Reference Price : 4840.08
| Buy |
|
Ready for trading?Start Now