CFDs are complex instruments and come with a high risk of losing money rapidly due to leverage. 71% of retail investor accounts lose money when trading CFDs with this provider. You should consider whether you understand how CFDs work and whether you can afford to take the high risk of losing your money.
CFDs are complex instruments and come with a high risk of losing money rapidly due to leverage. 70.91% of retail investor accounts lose money when trading CFDs with this provider. You should consider whether you understand how CFDs work and whether you can afford to take the high risk of losing all your money. Read full risk warning.

USA500 Analysis

EU Session Analysis for CFD Instruments 30/01/2024

Fundamental analysis

30 January, 2024

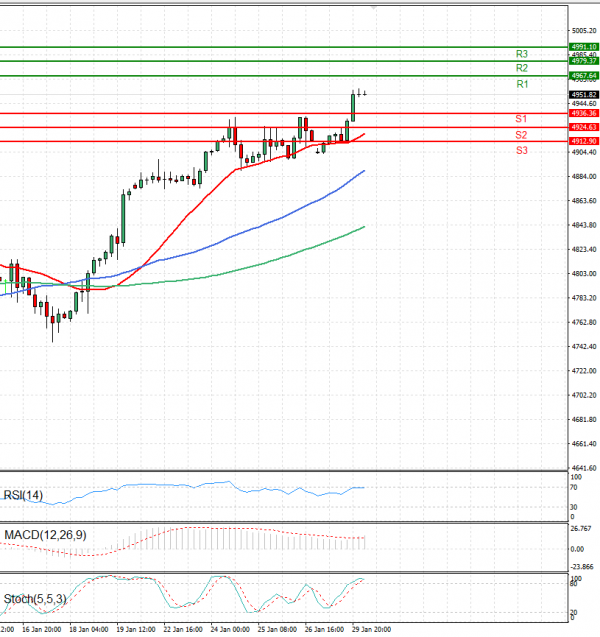
The USA500 is trading currently at 4,925.
The S&P 500, Nasdaq 100, and Dow Jones Industrial Average all closed at fresh record highs on Monday as investors gear up for mega-cap tech earnings.
Apple, Microsoft, Amazon, Alphabet, and Meta Platforms, cumulatively representing nearly $10 trillion in market value, are set to report their fourth-quarter earnings results this week, and the results could set the tone of the stock market for weeks to come.
So far, 25% of S&P 500 companies have reported their fourth-quarter earnings results, with 71% of those companies beating profit estimates by a median of 7% and 68% of those companies beating revenue estimates by a median of 2%, according to data from Fundstrat.

Technical analysis

USA500 Analysis Technical analysis 30/01/2024
Time Frame: 1 hour

USA500 Support & Resistance Table - 30/01/2024

Support & Resistance Level Explanation
Resistance 2 4979.37 Daily R2
Resistance 1 4967.64 Daily R1
Support 1 4936.36 Daily S1
Support 2 4924.63 Daily S2

USA500 Indicator Table - 30/01/2024

Indicator Signal
SMA 20 Buy
SMA 50 Buy
SMA 100 Buy
MACD( 12;26;9) Buy
RSI (14) Buy
Stochastic ( 9;6;3) Buy

USA500 Indicator / Period Table - 30/01/2024

Indicator / Period Day - BuyWeek - BuyMonth - Buy
MACD( 12;26;9) Buy BuyBuy
RSI (14) Buy BuyBuy
SMA 20 Buy BuyBuy

USA500 30/01/2024 - Reference Price : 4951.82

Buy
Simple Moving AverageBuy (3)Sell (0)
Technical Indicators - OscillatorsBuy (3)Sell (0)
Share It With Your Network
USA500 Chart
Update Time: -
Highest
Lowest
1M 5M H D W
Prices are loading..
Ready for trading?Start Now