CFDs are complex instruments and come with a high risk of losing money rapidly due to leverage. 77% of retail investor accounts lose money when trading CFDs with this provider. You should consider whether you understand how CFDs work and whether you can afford to take the high risk of losing your money.
CFDs are complex instruments and come with a high risk of losing money rapidly due to leverage. 76% of retail investor accounts lose money when trading CFDs with this provider. You should consider whether you can afford to take the high risk of losing your money.

USA500 Analysis

EU Session Analysis for CFD Instruments 29/02/2024

Fundamental analysis

29 February, 2024

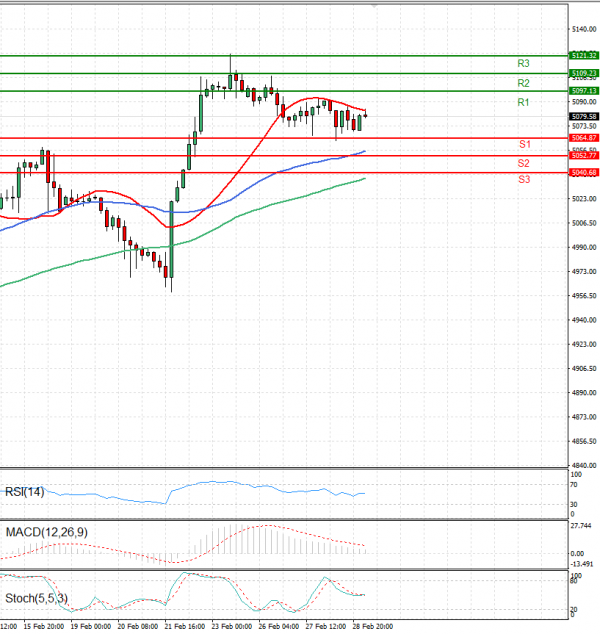
The USA500 is currently trading at 5,085.

U.S. stocks closed lower on Wednesday, a day ahead of a key inflation reading that could heavily shape expectations for the timing of an interest rate cut from the Federal Reserve.

The S&P 500 index ended the trading day on Wednesday at 5,058, down 0.38%.

Technical analysis

USA500 Analysis Technical analysis 29/02/2024
Time Frame: 1 hour

USA500 Support & Resistance Table - 29/02/2024

Support & Resistance Level Explanation
Resistance 2 5109.23 Daily R2
Resistance 1 5097.13 Daily R1
Support 1 5064.87 Daily S1
Support 2 5052.77 Daily S2

USA500 Indicator Table - 29/02/2024

Indicator Signal
SMA 20 Sell
SMA 50 Buy
SMA 100 Buy
MACD( 12;26;9) Buy
RSI (14) Neutral
Stochastic ( 9;6;3) Sell

USA500 Indicator / Period Table - 29/02/2024

Indicator / Period Day - SellWeek - BuyMonth - Buy
MACD( 12;26;9) Buy BuyBuy
RSI (14) Neutral BuyBuy
SMA 20 Sell BuyBuy

USA500 29/02/2024 - Reference Price : 5079.58

Sell
Simple Moving AverageBuy (2)Sell (1)
Technical Indicators - OscillatorsBuy (1)Sell (1)
Share It With Your Network
USA500 Chart
Update Time: -
Highest
Lowest
1M 5M H D W
Prices are loading..
Ready for trading?Start Now