CFDs are complex instruments and come with a high risk of losing money rapidly due to leverage. 71% of retail investor accounts lose money when trading CFDs with this provider. You should consider whether you understand how CFDs work and whether you can afford to take the high risk of losing your money.
CFDs are complex instruments and come with a high risk of losing money rapidly due to leverage. 70.91% of retail investor accounts lose money when trading CFDs with this provider. You should consider whether you understand how CFDs work and whether you can afford to take the high risk of losing all your money. Read full risk warning.

USA500 Analysis

EU Session Analysis for CFD Instruments 06/03/2024

Fundamental analysis

06 March, 2024

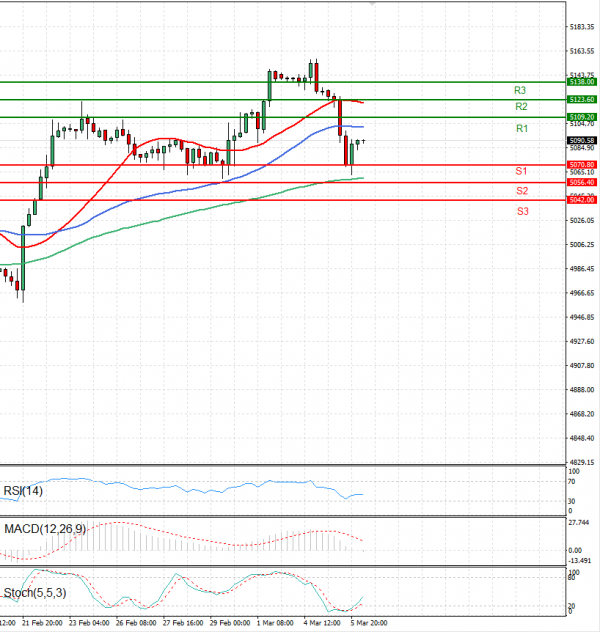
The USA500 is currently trading at 5,090.

Wall Street indexes closed lower on Tuesday, with weakness in megacap growth companies such as Apple Inc and the chip sector weighing on the Nasdaq ahead of this week's crop of economic data and remarks from Federal Reserve Chair Jerome Powell

The S&P 500 index ended the trading day on Tuesday at 5,079,10, down 1.01%.

Technical analysis

USA500 Analysis Technical analysis 06/03/2024
Time Frame: 1 hour

USA500 Support & Resistance Table - 06/03/2024

Support & Resistance Level Explanation
Resistance 2 5123.60 Daily R2
Resistance 1 5109.20 Daily R1
Support 1 5070.80 Daily S1
Support 2 5056.40 Daily S2

USA500 Indicator Table - 06/03/2024

Indicator Signal
SMA 20 Sell
SMA 50 Sell
SMA 100 Buy
MACD( 12;26;9) Buy
RSI (14) Neutral
Stochastic ( 9;6;3) Buy

USA500 Indicator / Period Table - 06/03/2024

Indicator / Period Day - BuyWeek - BuyMonth - Buy
MACD( 12;26;9) Buy BuyBuy
RSI (14) Neutral BuyBuy
SMA 20 Sell BuyBuy

USA500 06/03/2024 - Reference Price : 5090.58

Buy
Simple Moving AverageBuy (1)Sell (2)
Technical Indicators - OscillatorsBuy (2)Sell (0)
Share It With Your Network
USA500 Chart
Update Time: -
Highest
Lowest
1M 5M H D W
Prices are loading..
Ready for trading?Start Now