The USA500 is currently trading above 5,200 levels.
In evening trading on Tuesday, U.S. stock index futures showed some improvement, indicating a potential rebound on Wall Street. This comes after three consecutive days of losses for equities, driven by uncertainty surrounding upcoming inflation data and Federal Reserve announcements.
However, the gains were relatively modest, as the market appears to be in a holding pattern awaiting the release of crucial inflation figures later in the week, along with speeches from prominent Fed officials.
S&P 500 Futures climbed 0.2%, while Nasdaq 100 Futures also increased by 0.2%. Dow Jones Futures saw a similar rise of 0.2%.
USA500 Analysis
EU Session Analysis for CFD Instruments 27/03/2024
Technical analysis
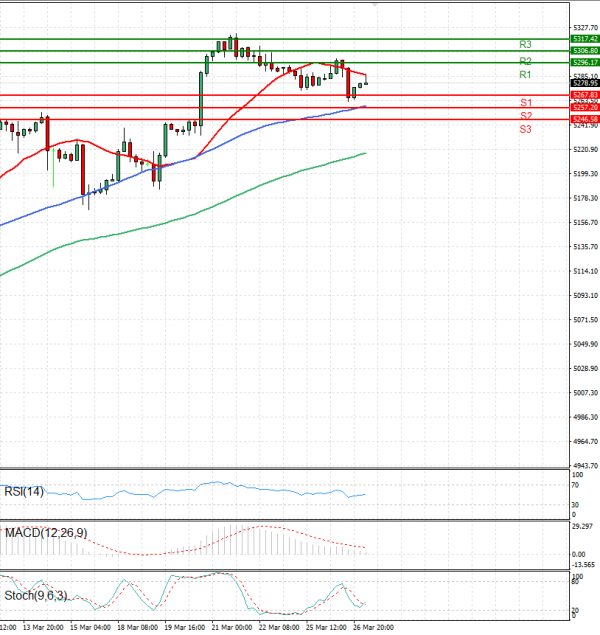
Time Frame: 1 hour
USA500 Support & Resistance Table - 27/03/2024
| Support & Resistance | Level | Explanation |
| Resistance 2 | 5306.80 | Daily R2 |
| Resistance 1 | 5296.17 | Daily R1 |
| Support 1 | 5267.83 | Daily S1 |
| Support 2 | 5257.20 | Daily S2 |
USA500 Indicator Table - 27/03/2024
| Indicator | Signal |
| SMA 20 | Sell |
| SMA 50 | Buy |
| SMA 100 | Buy |
| MACD( 12;26;9) | Buy |
| RSI (14) | Buy |
| Stochastic ( 9;6;3) | Buy |
USA500 Indicator / Period Table - 27/03/2024
| Indicator / Period | Day - Buy | Week - Buy | Month - Buy |
| MACD( 12;26;9) | Buy | Buy | Buy |
| RSI (14) | Buy | Buy | Buy |
| SMA 20 | Sell | Buy | Buy |
USA500 27/03/2024 - Reference Price : 5278.95
| Buy |
|
Ready for trading?Start Now