CFDs are complex instruments and come with a high risk of losing money rapidly due to leverage. 71% of retail investor accounts lose money when trading CFDs with this provider. You should consider whether you understand how CFDs work and whether you can afford to take the high risk of losing your money.
CFDs are complex instruments and come with a high risk of losing money rapidly due to leverage. 70.41% of retail investor accounts lose money when trading CFDs with this provider. You should consider whether you understand how CFDs work and whether you can afford to take the high risk of losing all your money. Read full risk warning.

USA500 Analysis

EU Session Analysis for CFD Instruments 15/04/2024

Fundamental analysis

15 April, 2024

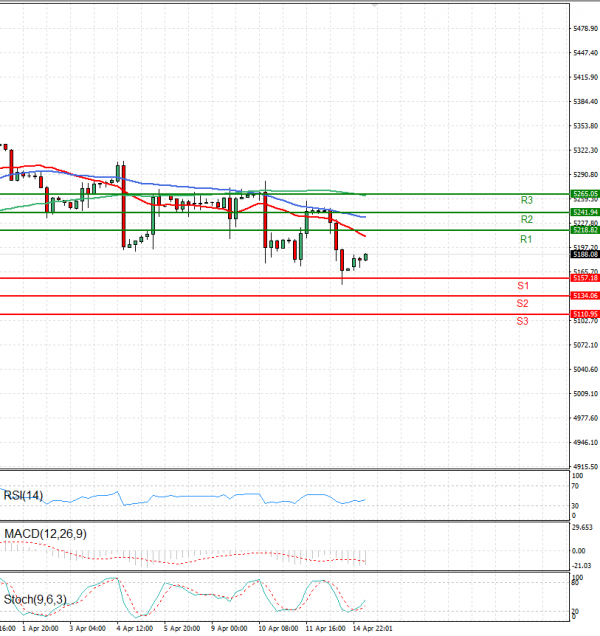
The USA500 is currently trading above 5,100 levels.

In evening trading on Sunday, US stock index futures saw a rise, partially recovering from significant losses last week. Concerns over a potential conflict between Iran and Israel dampened risk sentiment, while the beginning of the first quarter earnings season started on a negative note.

Additionally, indications of persistent inflation in the US led investors to largely dismiss expectations of a Federal Reserve interest rate cut in the first half of 2024, suggesting a scenario of higher rates for an extended period.

S&P 500 Futures increased by 0.3%, Nasdaq 100 Futures also rose by 0.3%, and Dow Jones Futures saw a 0.2% rise.

Technical analysis

USA500 Analysis Technical analysis 15/04/2024
Time Frame: 1 hour

USA500 Support & Resistance Table - 15/04/2024

Support & Resistance Level Explanation
Resistance 2 5241.94 Daily R2
Resistance 1 5218.82 Daily R1
Support 1 5157.18 Daily S1
Support 2 5134.06 Daily S2

USA500 Indicator Table - 15/04/2024

Indicator Signal
SMA 20 Sell
SMA 50 Sell
SMA 100 Sell
MACD( 12;26;9) Sell
RSI (14) Buy
Stochastic ( 9;6;3) Buy

USA500 Indicator / Period Table - 15/04/2024

Indicator / Period Day - SellWeek - BuyMonth - Buy
MACD( 12;26;9) Sell BuyBuy
RSI (14) Buy BuyBuy
SMA 20 Sell BuyBuy

USA500 15/04/2024 - Reference Price : 5188.08

Sell
Simple Moving AverageBuy (0)Sell (3)
Technical Indicators - OscillatorsBuy (2)Sell (1)
Share It With Your Network
USA500 Chart
Update Time: -
Highest
Lowest
1M 5M H D W
Prices are loading..
Ready for trading?Start Now