CFDs are complex instruments and come with a high risk of losing money rapidly due to leverage. 77% of retail investor accounts lose money when trading CFDs with this provider. You should consider whether you understand how CFDs work and whether you can afford to take the high risk of losing your money.
CFDs are complex instruments and come with a high risk of losing money rapidly due to leverage. 76% of retail investor accounts lose money when trading CFDs with this provider. You should consider whether you can afford to take the high risk of losing your money.

USA500 Analysis

EU Session Analysis for CFD Instruments 08/05/2024

Fundamental analysis

08 May, 2024

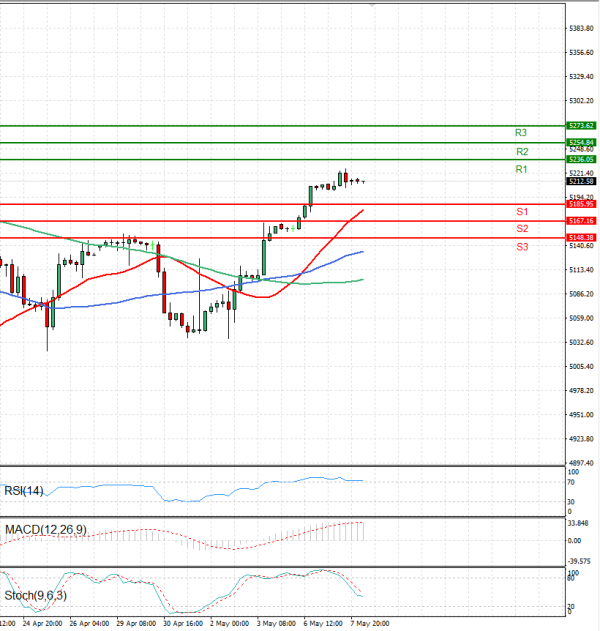
The USA500 is currently trading below 5,200 levels.

In Tuesday's evening trading, U.S. stock index futures remained relatively unchanged, mirroring a lukewarm session on Wall Street.

The recent surge driven by hopes for interest rate cuts tapered off, particularly as Federal Reserve officials hinted at maintaining current rates in the near future. With a lack of immediate catalysts, U.S. stocks exhibited muted movements, with investors adopting a cautious stance ahead of pivotal economic data releases and earnings reports.

S&P 500 Futures stabilised below the 5,200 mark, while Nasdaq 100 Futures showed minimal change. Dow Jones Futures lingered below 39,000 points.

Technical analysis

USA500 Analysis Technical analysis 08/05/2024
Time Frame: 1 hour

USA500 Support & Resistance Table - 08/05/2024

Support & Resistance Level Explanation
Resistance 2 5254.84 Daily R2
Resistance 1 5236.05 Daily R1
Support 1 5185.95 Daily S1
Support 2 5167.16 Daily S2

USA500 Indicator Table - 08/05/2024

Indicator Signal
SMA 20 Buy
SMA 50 Buy
SMA 100 Buy
MACD( 12;26;9) Buy
RSI (14) Neutral
Stochastic ( 9;6;3) Sell

USA500 Indicator / Period Table - 08/05/2024

Indicator / Period Day - BuyWeek - BuyMonth - Buy
MACD( 12;26;9) Buy BuyBuy
RSI (14) Neutral BuyBuy
SMA 20 Buy BuyBuy

USA500 08/05/2024 - Reference Price : 5212.58

Buy
Simple Moving AverageBuy (3)Sell (0)
Technical Indicators - OscillatorsBuy (1)Sell (1)
Share It With Your Network
USA500 Chart
Update Time: -
Highest
Lowest
1M 5M H D W
Prices are loading..
Ready for trading?Start Now