CFDs are complex instruments and come with a high risk of losing money rapidly due to leverage. 71% of retail investor accounts lose money when trading CFDs with this provider. You should consider whether you understand how CFDs work and whether you can afford to take the high risk of losing your money.
CFDs are complex instruments and come with a high risk of losing money rapidly due to leverage. 70.41% of retail investor accounts lose money when trading CFDs with this provider. You should consider whether you understand how CFDs work and whether you can afford to take the high risk of losing all your money. Read full risk warning.

USA500 Analysis

EU Session Analysis for CFD Instruments 16/05/2024

Fundamental analysis

16 May, 2024

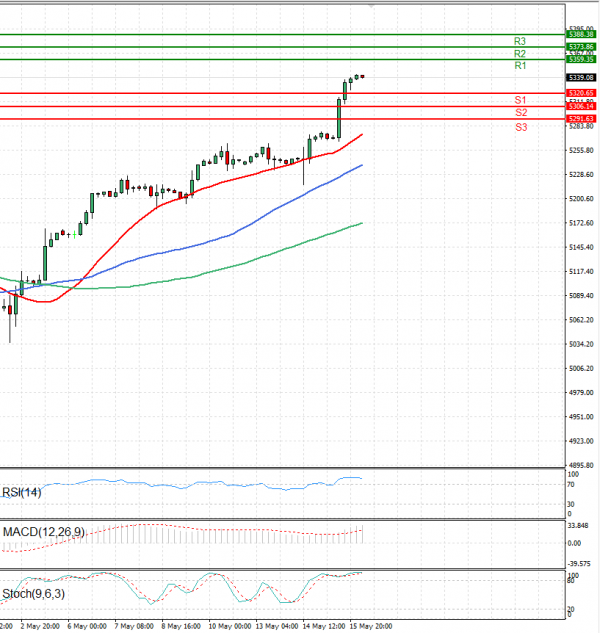
The USA500 is currently trading above 5,300 levels.

In evening trading on Wednesday, U.S. stock index futures surged, building on earlier gains driven by indications of a modest decrease in consumer inflation, which propelled Wall Street to achieve record highs amid expectations of forthcoming interest rate cuts.

Wall Street experienced a rally, accompanied by declines in the dollar and Treasury yields, following the release of consumer price index data slightly below expectations. This led traders to become increasingly convinced that the Federal Reserve would commence interest rate cuts in September.

The positive momentum extended into after-hours trading, with S&P 500 Futures rising by 0.1%. Nasdaq 100 Futures also saw a 0.2% increase, while Dow Jones Futures climbed by 0.1%.

Technical analysis

USA500 Analysis Technical analysis 16/05/2024
Time Frame: 1 hour

USA500 Support & Resistance Table - 16/05/2024

Support & Resistance Level Explanation
Resistance 2 5373.86 Daily R2
Resistance 1 5359.35 Daily R1
Support 1 5320.65 Daily S1
Support 2 5306.14 Daily S2

USA500 Indicator Table - 16/05/2024

Indicator Signal
SMA 20 Buy
SMA 50 Buy
SMA 100 Buy
MACD( 12;26;9) Buy
RSI (14) Neutral
Stochastic ( 9;6;3) Neutral

USA500 Indicator / Period Table - 16/05/2024

Indicator / Period Day - BuyWeek - BuyMonth - Buy
MACD( 12;26;9) Buy BuyBuy
RSI (14) Neutral BuyBuy
SMA 20 Buy BuyBuy

USA500 16/05/2024 - Reference Price : 5339.08

Buy
Simple Moving AverageBuy (3)Sell (0)
Technical Indicators - OscillatorsBuy (1)Sell (0)
Share It With Your Network
USA500 Chart
Update Time: -
Highest
Lowest
1M 5M H D W
Prices are loading..
Ready for trading?Start Now