CFDs are complex instruments and come with a high risk of losing money rapidly due to leverage. 71% of retail investor accounts lose money when trading CFDs with this provider. You should consider whether you understand how CFDs work and whether you can afford to take the high risk of losing your money.
CFDs are complex instruments and come with a high risk of losing money rapidly due to leverage. 70.41% of retail investor accounts lose money when trading CFDs with this provider. You should consider whether you understand how CFDs work and whether you can afford to take the high risk of losing all your money. Read full risk warning.

USA500 Analysis

EU Session Analysis for CFD Instruments 05/07/2024

Fundamental analysis

05 July, 2024

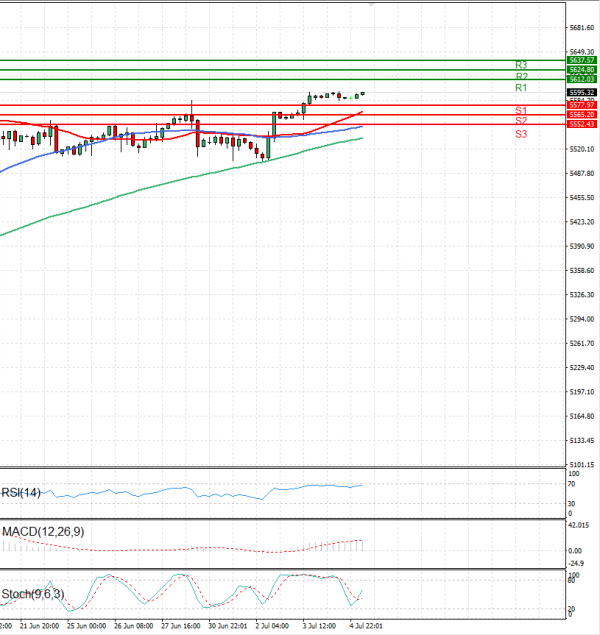
The USA500 is currently trading above 5,500 levels.

U.S. stock index futures showed little movement in light holiday trading on Thursday evening, with attention firmly on the upcoming nonfarm payrolls data for insights into potential interest rate changes.

Even though markets were closed for the Independence Day holiday, Wall Street indexes remained at record highs reached earlier in the week.

This was due to a series of weak economic readings that increased expectations that the Federal Reserve might begin cutting interest rates by September. However, some hawkish signals from the Fed tempered this expectation.

S&P 500 Futures remained steady, Nasdaq 100 Futures dipped 0.1%, and Dow Jones Futures rose slightly.

Technical analysis

USA500 Analysis Technical analysis 05/07/2024
Time Frame: 1 hour

USA500 Support & Resistance Table - 05/07/2024

Support & Resistance Level Explanation
Resistance 2 5624.80 Daily R2
Resistance 1 5612.03 Daily R1
Support 1 5577.97 Daily S1
Support 2 5565.20 Daily S2

USA500 Indicator Table - 05/07/2024

Indicator Signal
SMA 20 Buy
SMA 50 Buy
SMA 100 Buy
MACD( 12;26;9) Buy
RSI (14) Buy
Stochastic ( 9;6;3) Buy

USA500 Indicator / Period Table - 05/07/2024

Indicator / Period Day - BuyWeek - BuyMonth - Buy
MACD( 12;26;9) Buy BuyBuy
RSI (14) Buy BuyBuy
SMA 20 Buy BuyBuy

USA500 05/07/2024 - Reference Price : 5595.32

Buy
Simple Moving AverageBuy (3)Sell (0)
Technical Indicators - OscillatorsBuy (3)Sell (0)
Share It With Your Network
USA500 Chart
Update Time: -
Highest
Lowest
1M 5M H D W
Prices are loading..
Ready for trading?Start Now