CFDs are complex instruments and come with a high risk of losing money rapidly due to leverage. 71% of retail investor accounts lose money when trading CFDs with this provider. You should consider whether you understand how CFDs work and whether you can afford to take the high risk of losing your money.
CFDs are complex instruments and come with a high risk of losing money rapidly due to leverage. 70.91% of retail investor accounts lose money when trading CFDs with this provider. You should consider whether you understand how CFDs work and whether you can afford to take the high risk of losing all your money. Read full risk warning.

USA500 Analysis

EU Session Analysis for CFD Instruments 28/10/2024

Fundamental analysis

28 October, 2024

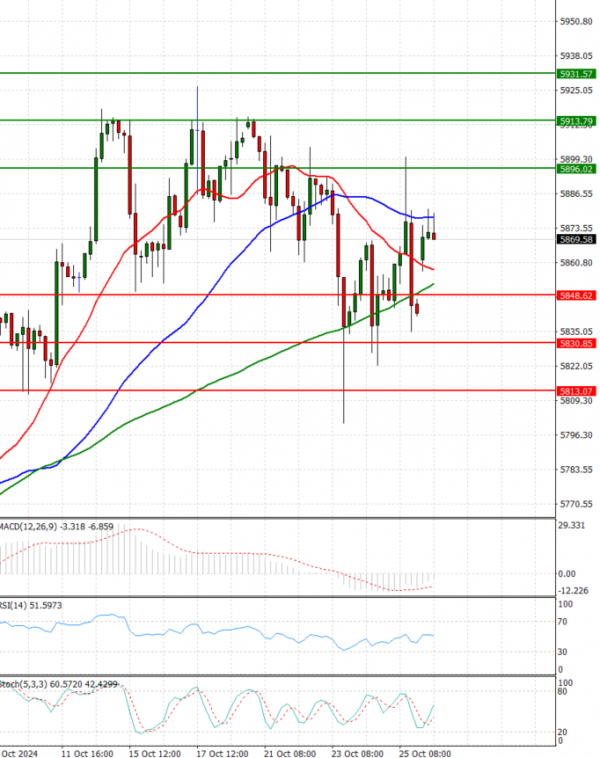
The USA500 is currently trading above 5,800 levels.

The Nasdaq ended higher on Friday, driven by megacap shares, as investors awaited quarterly results from some of Wall Street's biggest companies next week.

On Friday the S&P 500 fell 0.03%, the Nasdaq 100 climbed 0.56%, while the Dow Jones was down 0.61%.

Technical analysis

USA500 Analysis Technical analysis 28/10/2024
Time Frame: 1 hour

USA500 Support & Resistance Table - 28/10/2024

Support & Resistance Level Explanation
Resistance 2 5913.79 Daily R2
Resistance 1 5896.02 Daily R1
Support 1 5848.62 Daily S1
Support 2 5830.85 Daily S2

USA500 Indicator Table - 28/10/2024

Indicator Signal
SMA 20 Buy
SMA 50 Sell
SMA 100 Buy
MACD( 12;26;9) Sell
RSI (14) Buy
Stochastic ( 9;6;3) Buy

USA500 Indicator / Period Table - 28/10/2024

Indicator / Period Day - BuyWeek - BuyMonth - Buy
MACD( 12;26;9) Sell BuyBuy
RSI (14) Buy BuyBuy
SMA 20 Buy BuyBuy

USA500 28/10/2024 - Reference Price : 5872.32

Buy
Simple Moving AverageBuy (2)Sell (1)
Technical Indicators - OscillatorsBuy (2)Sell (1)
Share It With Your Network
USA500 Chart
Update Time: -
Highest
Lowest
1M 5M H D W
Prices are loading..
Ready for trading?Start Now