CFDs are complex instruments and come with a high risk of losing money rapidly due to leverage. 71% of retail investor accounts lose money when trading CFDs with this provider. You should consider whether you understand how CFDs work and whether you can afford to take the high risk of losing your money.
CFDs are complex instruments and come with a high risk of losing money rapidly due to leverage. 70.41% of retail investor accounts lose money when trading CFDs with this provider. You should consider whether you understand how CFDs work and whether you can afford to take the high risk of losing all your money. Read full risk warning.

USA500 Analysis

EU Session Analysis for CFD Instruments 12/03/2025

Fundamental analysis

12 March, 2025

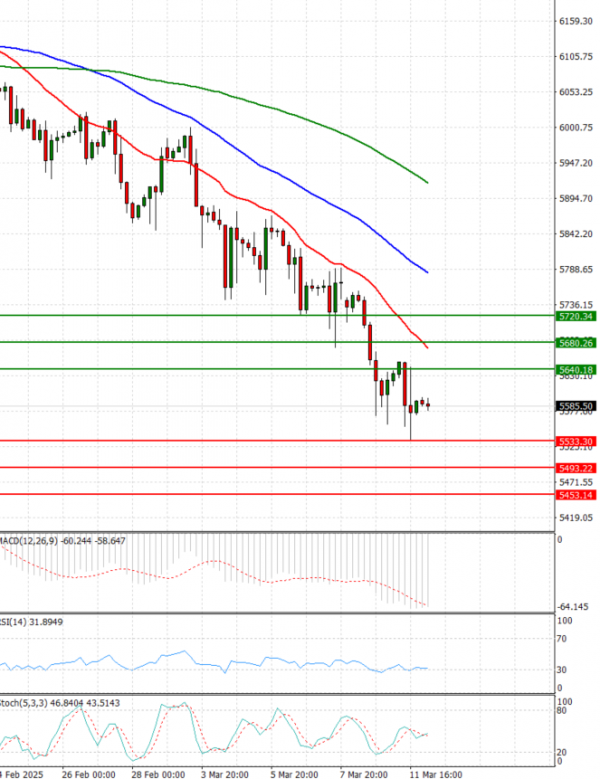
The USA500 is currently trading below 5,600 levels.

U.S. stocks fell on Tuesday, adding to the biggest selloff in months, as investors worried about the impact of the latest tariff threats on the global economy.

On Tuesday the S&P 500 was down 0.76%, the Dow Jones fell 1.14% and the Nasdaq declined 0.18%.

Technical analysis

USA500 Analysis Technical analysis 12/03/2025
Time Frame: 1 hour

USA500 Support & Resistance Table - 12/03/2025

Support & Resistance Level Explanation
Resistance 2 5680.26 Daily R2
Resistance 1 5640.18 Daily R1
Support 1 5533.30 Daily S1
Support 2 5493.22 Daily S2

USA500 Indicator Table - 12/03/2025

Indicator Signal
SMA 20 Sell
SMA 50 Sell
SMA 100 Sell
MACD( 12;26;9) Sell
RSI (14) Sell
Stochastic ( 9;6;3) Sell

USA500 Indicator / Period Table - 12/03/2025

Indicator / Period Day - SellWeek - SellMonth - Sell
MACD( 12;26;9) Sell SellSell
RSI (14) Sell SellSell
SMA 20 Sell SellSell

USA500 12/03/2025 - Reference Price : 5586.74

Sell
Simple Moving AverageBuy (0)Sell (3)
Technical Indicators - OscillatorsBuy (0)Sell (3)
Share It With Your Network
USA500 Chart
Update Time: -
Highest
Lowest
1M 5M H D W
Prices are loading..
Ready for trading?Start Now