CFDs are complex instruments and come with a high risk of losing money rapidly due to leverage. 66% of retail investor accounts lose money when trading CFDs with this provider. You should consider whether you understand how CFDs work and whether you can afford to take the high risk of losing your money.
CFDs are complex instruments and come with a high risk of losing money rapidly due to leverage. 70.91% of retail investor accounts lose money when trading CFDs with this provider. You should consider whether you understand how CFDs work and whether you can afford to take the high risk of losing all your money. Read full risk warning.

USA500 Analysis

EU Session Analysis for CFD Instruments 25/03/2025

Fundamental analysis

25 March, 2025

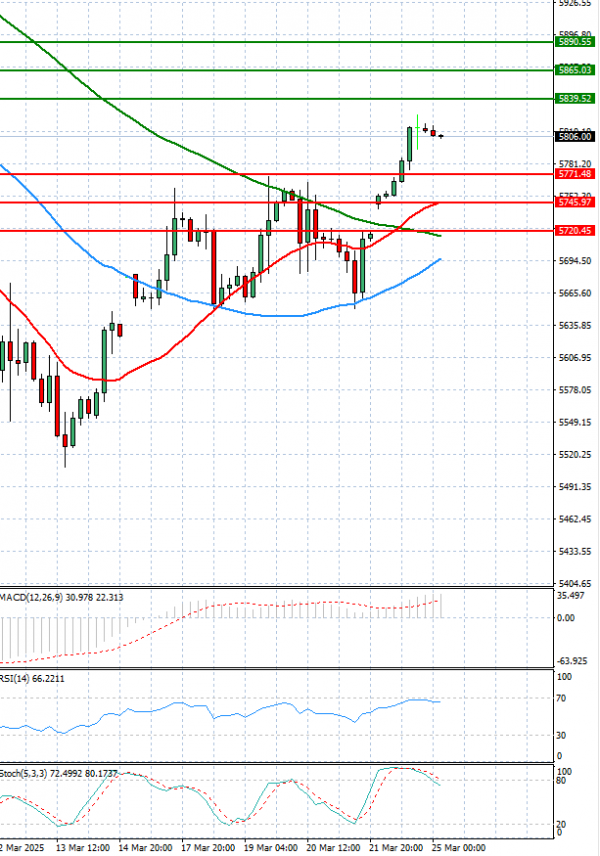
The USA500 is currently trading above 5,800 levels.

The S&P 500 rose sharply to end at its highest in over two weeks on Monday, lifted by Nvidia and Tesla following signs that the Trump administration might take a more measured approach on tariffs against U.S. trading partners.

On Monday the S&P 500 was up 1.76%, the Dow Jones increased 1.42% and the Nasdaq surged 2.27%.

Technical analysis

USA500 Analysis Technical analysis 25/03/2025
Time Frame: 1 hour

USA500 Support & Resistance Table - 25/03/2025

Support & Resistance Level Explanation
Resistance 2 5865.03 Daily R2
Resistance 1 5839.52 Daily R1
Support 1 5771.48 Daily S1
Support 2 5745.97 Daily S2

USA500 Indicator Table - 25/03/2025

Indicator Signal
SMA 20 Buy
SMA 50 Buy
SMA 100 Buy
MACD( 12;26;9) Buy
RSI (14) Buy
Stochastic ( 9;6;3) Buy

USA500 Indicator / Period Table - 25/03/2025

Indicator / Period Day - BuyWeek - BuyMonth - Sell
MACD( 12;26;9) Buy SellBuy
RSI (14) Buy BuySell
SMA 20 Buy BuySell

USA500 25/03/2025 - Reference Price : 5805.50

Buy
Simple Moving AverageBuy (3)Sell (0)
Technical Indicators - OscillatorsBuy (3)Sell (0)
Share It With Your Network
USA500 Chart
Update Time: -
Highest
Lowest
1M 5M H D W
Prices are loading..
Ready for trading?Start Now