Fortrade Canada Ltd. as an order-execution only dealer is not permitted to provide you with any advice or recommendations. These Market Commentaries should not be construed as a recommendation, advice or any attempt by Fortrade Canada Ltd. to prompt or influence you in making an investment decision to purchase, sell, hold or exchange any security or to influence the timing of such activity. This content is produced by Fortrade Limited which is not registered in any capacity with any securities regulatory authority in Canada.
69% of retail investor accounts lose money when trading CFDs with this provider.
CFDs are complex instruments and come with a high risk of losing money rapidly due to leverage. 69% of retail investor accounts lose money when trading CFDs with this provider. You should consider whether you understand how CFDs work and whether you can afford to take the high risk of losing your money.
67.52% of retail investor accounts lose money when trading CFDs with this provider.
CFDs are complex instruments and come with a high risk of losing money rapidly due to leverage. 67.52% of retail investor accounts lose money when trading CFDs with this provider. You should consider whether you understand how CFDs work and whether you can afford to take the high risk of losing all your money. Read full risk warning.
EU Session Analysis for CFD Instruments 06/06/2025
Fundamental analysis
06 June, 2025
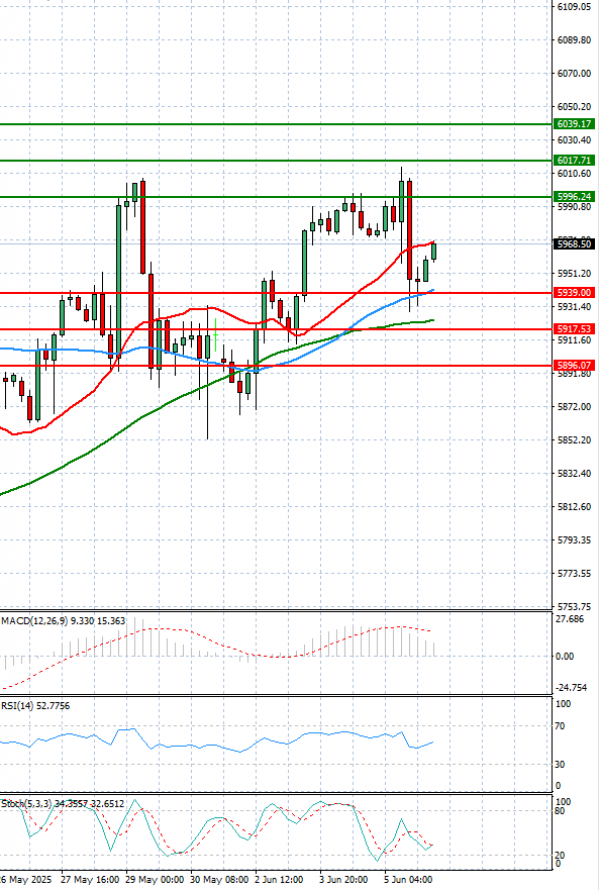
The USA500 is currently trading below 6,000 levels.
Wall Street's stock indexes ended lower on Thursday in choppy trade as a slump in Tesla shares offset news of progress in tariff talks between U.S. President Donald Trump and Chinese leader Xi Jinping.
On Thursday the S&P 500 fell 0.53%, the Dow Jones fell 0.25% and the Nasdaq dropped 0.83%.