USD/CAD weekly special report based on 1 Lot Calculation:
TECHNICAL ANALYSIS:
- RESISTANCE AREA ABOVE 1.3900: USD/CAD has maintained long term resistance in the area above the mark of 1.3900, as shown by the weekly chart below.
- WEEKLY MOVING AVERAGES POINT TO DOWTREND: USD/CAD has recently traded below the 20- and 50- Week Moving Averages, pointing to an ongoing downtrend. However, USD/CAD could also change its trend, if prices rise above the 20- and 50- Week Moving Averages.
- LONGER-TERM TREND CHANNEL: The black- lined downtrend channel depicted by the chart below shows that USD/CAD have maintained its downtrend in general since early 2025.
- RESISTANCE AND SUPPORT LEVELS: USD/CAD has remained in a downtrend looking at Support 1 of 1.3610, Support 2 of 1.3500 and Support 3 of 1.3400 to the downside. On the upside, USD/CAD looks at Resistance 1 of 1.3800, then towards Resistance 2 of 1.3850 and Resistance 3 of 1.3900.
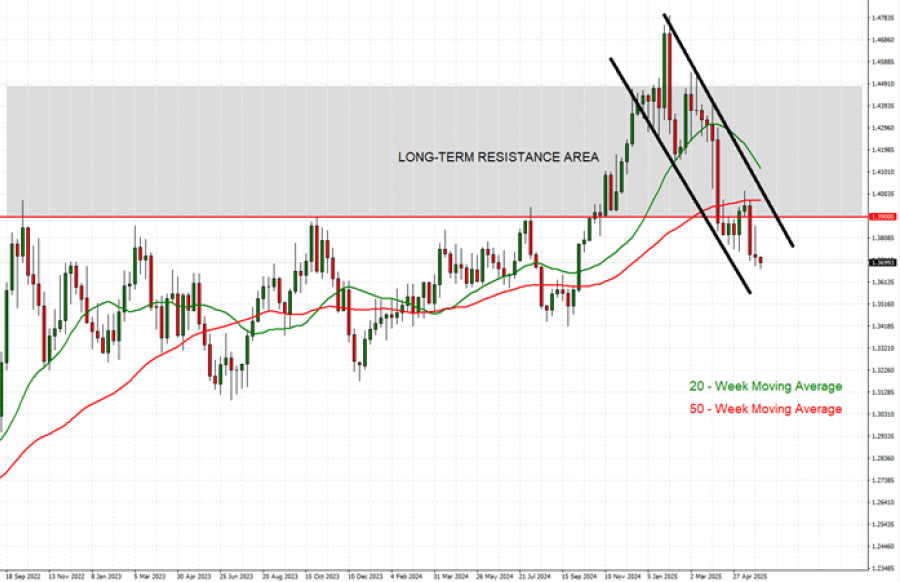
GRAPH (Weekly): September 2022 – June 2025
Please note that past performance does not guarantee future results
EVENTS (CANADA):
- WEDNESDAY, JUNE 4, AT 14:45 GMT+1: BANK OF CANADA INTEREST RATE DECISION: The Bank of Canada could keep its benchmark interest rate unchanged, at 2.75%. A pause in the interest rate cut cycle is expected to create negative pressures for the USDCAD pair, as a paused interest rate will create positive upswing for the Canadian dollar.
EVENTS (UNITED STATES):
- FRIDAY, JUNE 6, AT 13:30 GMT+1: US NON-FARM PAYROLL (NFP) AND UNEMPLOYMENT RATE (MAY): A lower-than-expected NFP reading should be taken as negative for the USDCAD currency pair, because a weaker US economy could exert negative pressures on the US dollar. This data measures the change in the number of people employed during the previous month, excluding the farming industry. The data for the previous month stood at 177,000 which lower than for the month before (228,000).
USD/CAD June 2, 2025
Current Price: 1.3710
|
USD/CAD |
Weekly |
|
Trend direction |
|
|
1.3900 |
|
|
1.3850 |
|
|
1.3800 |
|
|
1.3610 |
|
|
1.3500 |
|
|
1.3400 |
Example of calculation based on weekly trend direction for 1 Lot1
|
USD/CAD |
||||||
|
Pivot Points |
||||||
|
Profit or loss in $ |
-1,387 |
-1,022 |
-657 |
730 |
1,533 |
2,263 |
|
Profit or loss in €2 |
-1,213 |
-894 |
-575 |
638 |
1,341 |
1,979 |
|
Profit or loss in £2 |
-1,024 |
-755 |
-485 |
539 |
1,132 |
1,672 |
|
Profit or loss in C$2 |
-1,900 |
-1,400 |
-900 |
1,000 |
2,100 |
3,100 |
- 1.00 lot is equivalent of 100,000 units
- Calculations for exchange rate used as of 13:15 (GMT+1) 02/06/2025
There is a possibility to use Stop-Loss and Take-Profit.
- You may wish to consider closing your position in profit, even if it is lower than suggested one.
- Trailing stop technique could protect the profit.