WEEKLY TREND: UP
Fundamental Overview:
- BIG US FISCAL STIMULUS: US President Joseph Biden signed the $1.9 trillion stimulus into law on March 11. Most Americans will be receiving direct payments of $1,400, with the money starting to go out within days (around $325 billion have been already sent out of $400 billion expected). The bill provides new health-insurance subsidies and child-tax credits, while extending $300 per week supplemental unemployment benefits into September. There’s also $360 billion for state and local governments, a bailout for troubled union pensions and funds to ramp up vaccinations and school re-openings. In December 2020, the U.S. Congress approved an $892 billion coronavirus aid package.
NEXT: Infrastructure bill potentially worth around 3 trillion dollars. - BIG US MONETARY STIMULS: FEDERAL RESERVE TO KEEP INTEREST RATES LOW UNTILL THE END OF 2023: The Fed confirmed the bank will not raise interest rates (0.00%- 0.25%) until the US economy shows evidence it has fully recovered from Covid-19 (through 2023), eliminating doubts that interest rate hikes could come earlier. They will not reduce monthly bond purchases of 120 billion dollars until they see substantial progress neither. They repeated language saying that policy will remain accommodative until inflation runs moderately above 2% for some time. The US Federal Reserve will meet next on April 28, 2021.
- MORE THAN 3 TRILLION DOLLARS TO BE INJECTED INTO THE U.S. ECONOMY IN 2021, INFLATION MAY RISE: Increased money supply in the U.S. is expected to increase upward pressure on inflation, which could grow hot later this year. Therefore, the US Dollar’s purchasing power could fall, while investors could be expected to seek protection with the safe- haven Gold. To this end, the markets could still expect the Gold prices to recover.
- ANALYSTS OPINION (GOLDMAN SACHS/BANK OF AMERICA/CITIGROUP): GOLDMAN SACHS has a target price of $2000. BANK OF AMERICA 2021 estimate at an average of $2063. CITIGROUP targets Gold at $1950 in 2021.
Technical Overview
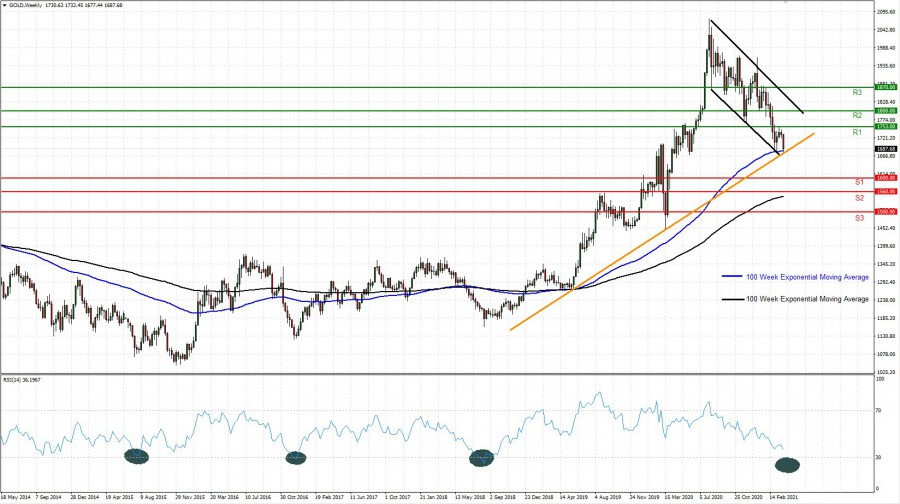
- Gold has fallen below its psychical support level of 1700. However, Gold has managed to stay above its lower downtrend channel line to suggest a potential upward recovery towards its upper downtrend channel line.
- Gold has managed to stay above its 100 Week Exponential Moving Average suggesting an upward recovery as well.
- According to its Weekly Relative Strength Index (RSI), Gold’s downside risk is limited as the RSI has gone down close to its oversold threshold of 30 (Currently at 36). Last time, the weekly RSI has fallen that low was in 2018, when Gold prices started off a multi- year bull trend (uptrend).
Graph: (Gold, Weekly)
Current Price: 1676
|
GOLD |
Weekly |
|
Trend direction |
|
|
1870 |
|
|
1800 |
|
|
1753 |
|
|
1600 |
|
|
1560 |
|
|
1500 |
Example of calculation based on trend direction for 1.00 Lot*
|
GOLD |
||||||
|
Pivot Points |
||||||
|
Profit or loss in $ |
19,400.00 |
12,400.00 |
7,700.00 |
-7,600.00 |
-11,600.00 |
-17,600.00 |
|
Profit or loss in €** |
16,532.02 |
10,566.86 |
6,561.68 |
-6,476.46 |
-9,885.13 |
-14,998.13 |
|
Profit or loss in £** |
14,090.03 |
9,006.00 |
5,592.43 |
-5,519.81 |
-8,424.97 |
-12,782.71 |
|
Profit or loss in C$** |
24,442.06 |
15,622.76 |
9,701.23 |
-9,575.24 |
-14,614.84 |
-22,174.24 |
* 1.00 lot is equivalent of 100 units
** Calculations for exchange rate used as of 14:04 (GMT+1) 31/03/2021
Fortrade recommends the use of Stop-Loss and Take-Profit, please speak to your Client Manager regarding their use.
*** You may wish to consider closing your position in profit, even if it is lower than suggested one
**** Trailing stop technique can protect the profit – Ask your Client Manager for more details