WEEKLY TREND: UP
Fundamental Overview:
- EVENT (AUGUST 11, WEDNESDAY AT 13:30 GMT+1) INFLATION (CPI) FOR JULY (EXPECTED: 5.3%): DATA IN JUNE CAME IN AT 5.40% vs. EXPECTED 4.9% (HIGHEST SINCE 2008). Inflation has continued to rise, moved up by high stimulus packages provided by the US Federal Reserve and the US Congress. A rising inflation usually increases demand for gold as the asset is traditionally considered a store of value, which tends to protect the purchasing power of people’s wealth amid higher inflation.
- EVENT: JACKSON HOLE SYMPOSIUM (AUGUST 26- 28): The Federal Reserve Bank of Kansas City hosts dozens of central bankers, policymakers, academics and economists from around the world at its annual economic policy symposium in Jackson Hole, Wyoming. Symposium participants include prominent central bankers, finance ministers, academics, and financial market participants from around the world. The participants convene to discuss the economic issues, implications, and policy options pertaining to the symposium topic. The symposium proceedings include papers, commentary, and discussion. Fed Chair Jerome Powell will be expected to talk about the Fed policy (and the upcoming bond programme tapering) as well.
Technical Overview:
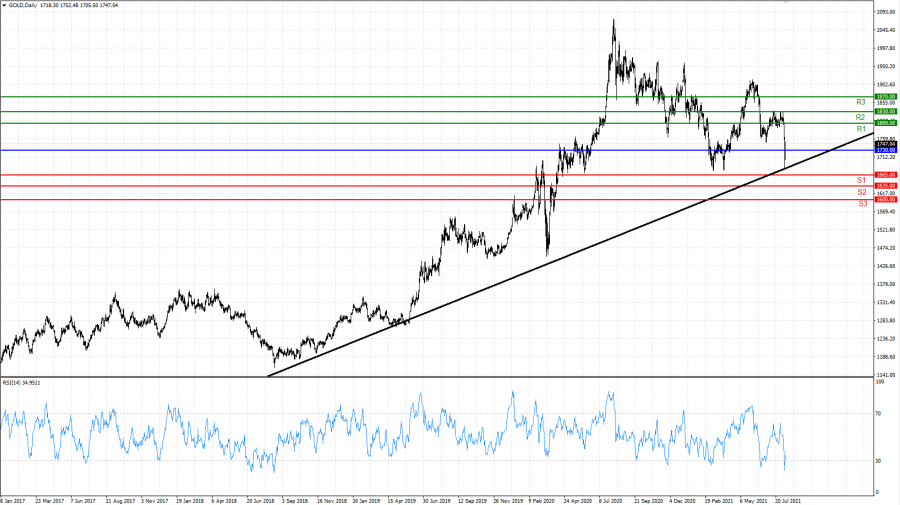
- LONG TERM UPTREND: Despite the most recent sell- off, Gold managed to stay above it long term uptrend line. This could suggest an upward recovery as long as it stays above the uptrend (black) line.
- 14-DAY RELATIVE STRENGTH INDEX (RSI): The 14-Week RSI has fallen below the oversold threshold of 30, which indicates that Gold has been oversold as of late. This, in turn, signals a potential upward correction is imminent.
- RESISTANCE AND SUPPORT LEVELS: If Gold manages to stay above the uptrend line and speculators gather up to trade on 14- Day RSI oversold signal, then it could be expected the prices to start recovering, targeting Resistance 1 of 1800. If, however, the prices fail to uptrend line, then it could be expected Gold to continue falling and target Support 1 of 1665.
Graph: GOLD, Daily
Current Price: 1730
|
GOLD |
Weekly |
|
Trend direction |
|
|
1870 |
|
|
1830 |
|
|
1800 |
|
|
1665 |
|
|
1635 |
|
|
1600 |
Example of calculation based on weekly trend direction for 1.00 Lot*
|
GOLD |
||||||
|
Profit or loss in $** |
14,000.00 |
10,000.00 |
7,000.00 |
-6,500.00 |
-9,500.00 |
-13,000.00 |
|
Profit or loss in € |
11,908.10 |
8,505.79 |
5,954.05 |
-5,528.76 |
-8,080.50 |
-11,057.52 |
|
Profit or loss in £** |
10,105.09 |
7,217.92 |
5,052.55 |
-4,691.65 |
-6,857.03 |
-9,383.30 |
|
Profit or loss in C$** |
17,576.44 |
12,554.60 |
8,788.22 |
-8,160.49 |
-11,926.87 |
-16,320.98 |
* 1.00 lot is equivalent of 100 units
** Calculations for exchange rate used as of 09:30 (GMT+1) 09/08/2021
Fortrade recommends the use of Stop-Loss and Take-Profit, please speak to your Client Manager regarding their use.
*** You may wish to consider closing your position in profit, even if it is lower than suggested one
**** Trailing stop technique can protect the profit – Ask your Client Manager for more details