WEEKLY TREND: UP
Fundamental Overview:
EVENT: JACKSON HOLE SYMPOSIUM (AUGUST 26-28): The Federal Reserve Bank of Kansas City said on Friday its annual economic symposium in Jackson Hole, Wyoming, will take place on Aug. 27 virtually and not in person as planned, a sign of the impact of the COVID-19 Delta variant on the Fed's plans. On Friday, August 27, FOMC Chairman Jerome Powell will deliver his speech. If Powell reassures markets that the dovish outlook will remain constant for the rest of the year, the USD could come under strong bearish pressure and fuel a gold price rally.
EVENT (AUGUST 26, Thursday at 13:30 GMT+1) GDP FOR Q2 (EXPECTED: 6.7%): DATA IN JULY CAME IN AT 6.5% vs. EXPECTED 8.5%. This will be the second publishing of second quarter numbers. The IMF updated its growth forecasts for the US economy to 7.0 % in 2021 and 4.9 % in 2022, up 0.6 and 1.4% respectively, from initial forecasts in April. U.S. economic growth for the second quarter is likely to be revised higher following stronger than previously thought data in that period, which reflected the economy's reopening amid improved public health in this period. If the numbers come out lower than expected that could give additional support to gold prices.
Dallas Federal Reserve President Robert Kaplan, among the U.S. central bank's most vocal supporters for starting to reduce support for the economy, said at the end last week, he may need to change that view if the Delta variant of the coronavirus slows economic growth. Another signal that Fed may postpone normalisation of monetary policy which is supportive for gold prices.
Technical Overview:
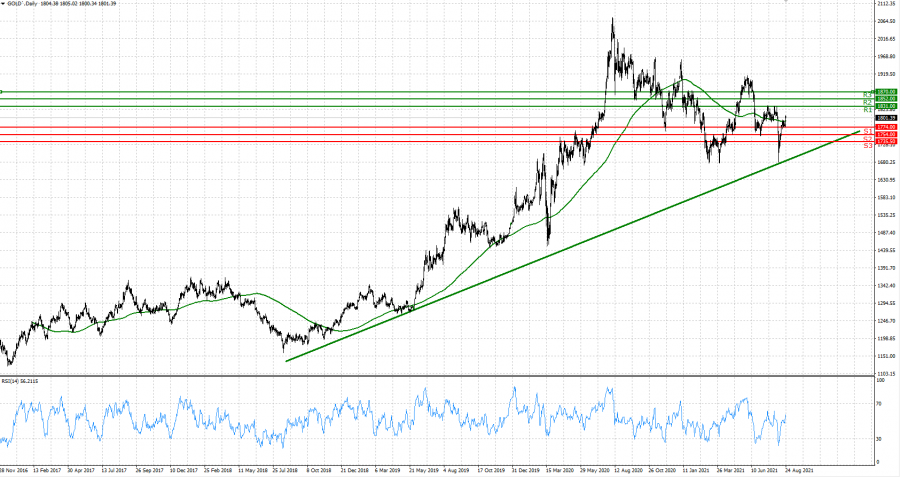
LONG TERM UPTREND: Despite the most recent sell-off, Gold managed to stay above its long term uptrend line. This could suggest an upward recovery as long as it stays above the uptrend (green) line.
14-DAY RELATIVE STRENGTH INDEX (RSI): The 14-Week RSI has moved near the 50 threshold which indicates that Gold is leaving the oversold zone. This signals a potential continuation of the upward correction.
RESISTANCE AND SUPPORT LEVELS: If Gold manages to stay above the uptrend line with 14-Day RSI moving further up from oversold territory, then the price recovery could be expected to continue towards Resistance 1 of 1831. If, however, the price fails to stay above the uptrend line, then it could be expected that Gold could fall back down and target Support 1 of 1774.
Graph: Gold, weekly
Gold, August 24, 2021
Current Price: 1,801.07
|
Gold |
Weekly |
|
Trend direction |
|
|
1,870.00 |
|
|
1,852.00 |
|
|
1,831.00 |
|
|
1,774.00 |
|
|
1,754.00 |
|
|
1,735.50 |
Example of calculation based on weekly trend direction for 1.00 Lot*
|
Gold |
||||||
|
Pivot Points |
||||||
|
Profit or loss in $ |
6,893.00 |
5,093.00 |
2,993.00 |
-2,707.00 |
-4,707.00 |
-6,557.00 |
|
Profit or loss in €** |
5,870.18 |
4,337.27 |
2,548.88 |
-2,305.32 |
-4,008.55 |
-5,584.04 |
|
Profit or loss in £** |
5,017.10 |
3,706.97 |
2,178.47 |
-1,970.30 |
-3,426.01 |
-4,772.55 |
|
Profit or loss in C$** |
8,900.66 |
6,576.39 |
3,864.74 |
-3,495.44 |
-6,077.96 |
-8,466.79 |
* 1.00 lot is equivalent of 100 units
** Calculations for exchange rate used as of 10:10 (GMT+1) 24/08/2021
Fortrade recommends the use of Stop-Loss and Take-Profit, please speak to your Client Manager regarding their use.
*** You may wish to consider closing your position in profit, even if it is lower than suggested one
**** Trailing stop technique can protect the profit – Ask your Client Manager for more detail