WEEKLY TREND: UP
Fundamental Overview:
- EVENT (TUESDAY, SEPTEMBER 14 AT 13:30 GMT+1): INFLATION (CPI) IN THE U.S. FOR AUGUST. INFLATION (CPI) FOR JULY (5.4% vs. 5.3% exp.) (HIGHEST SINCE 2008). Inflation has continued to rise, moved up by high stimulus packages provided by the US Federal Reserve and the US Congress. A rising inflation usually increases demand for gold as the asset is traditionally considered a store of value, which tends to protect the purchasing power of people’s wealth amid higher inflation.
- EVENT (WEDNESDAY, SEPTEMBER 22 AT 19:00 GMT+1): FEDERAL RESERVE MEETING. Another delay of stimulus tapering announcement now expected: FED MEETING JULY 28 (PREVIOUS MEETING): INTEREST RATE: Interest rate stay in the range between 0.00% and 0.25%. BOND PURCHASING PROGRAMME (120 billion dollars per month): For the moment they will keep buying the same amount. FED CHAIR JEROME POWELL: “Still some ground to cover before substantial further progress is achieved. The timing of any taper will depend on incoming data and we will provide advance notice before any changes. I'm not in any position to provide any guidance on the timing of the taper. We're clearly a ways away from raising interest rates; it's not on our radar now. Delta could slow the economy down for a period of months”.
- ANALYSTS OPINION (GOLDMAN SACHS/CITIGROUP/WELLS FARGO/COMMERZBANK/ CREDIT SUISSE/ BANK OF AMERICA): GOLDMAN SACHS has a target price of $2000. CITIGROUP price target stands at 1950. WELLS FARGO sees Gold at $2100-$2200 in 2021. COMMERZBANK expected gold prices to return to $2000 by the end of the year. CREDIT SUISSE targets the area OF $1959-$1966, which rally could potentially extend to $2075. BANK OF AMERICA maintains an average price target of $1845 for 2021.
Technical Overview:
- LONG TERM UPTREND: Despite the most recent sell-off, Gold still trades above its long term uptrend line. This could suggest an upward recovery as long as it stays above the uptrend (black) line.
- 14-DAY RELATIVE STRENGTH INDEX (RSI): The 14-Day RSI has fallen again below the level of 50, towards the oversold threshold of 30, which indicates that Gold can become oversold soon. When an instrument becomes oversold, it usually triggers upward movements due to bigger price attractiveness.
- RESISTANCE AND SUPPORT LEVELS: If Gold manages to stay above the uptrend line and speculators gather up to trade on 14-Day RSI oversold signal, then it could be expected the prices to start recovering, targeting Resistance 1 of 1829. If, however, the prices fail to uptrend line, then it could be expected Gold to continue falling and target Support 1 of 1740.
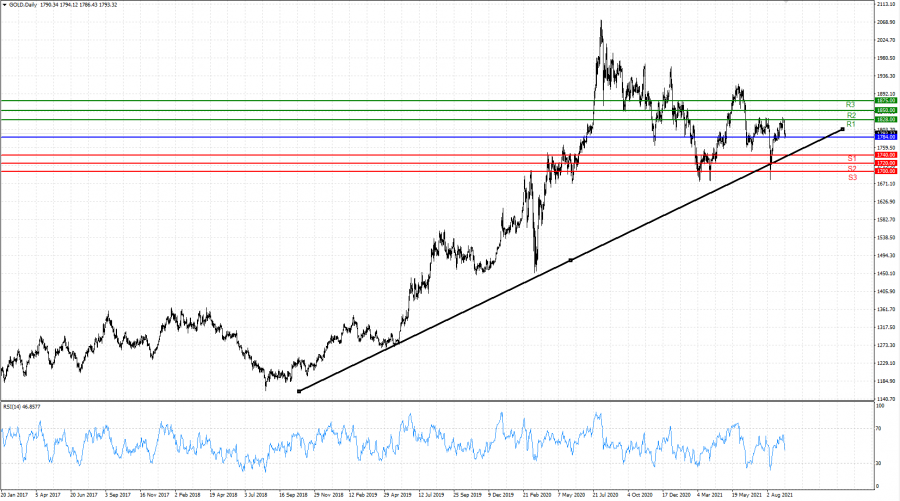
Graph: GOLD, Daily
Current Price: 1784
|
GOLD |
Weekly |
|
Trend direction |
|
|
1875 |
|
|
1850 |
|
|
1829 |
|
|
1740 |
|
|
1720 |
|
|
1700 |
Example of calculation based on weekly trend direction for 1.00 Lot*
|
GOLD |
||||||
|
Profit or loss in $** |
9,100.00 |
6,600.00 |
4,500.00 |
-4,400.00 |
-6,400.00 |
-8,400.00 |
|
Profit or loss in € |
7,695.23 |
5,581.16 |
3,805.34 |
-3,720.77 |
-5,412.03 |
-7,103.29 |
|
Profit or loss in £** |
6,604.54 |
4,790.11 |
3,265.98 |
-3,193.40 |
-4,644.95 |
-6,096.50 |
|
Profit or loss in C$** |
11,575.20 |
8,395.20 |
5,724.00 |
-5,596.80 |
-8,140.80 |
-10,684.80 |
* 1.00 lot is equivalent of 100 units
** Calculations for exchange rate used as of 09:30 (GMT+1) 09/09/2021
Fortrade recommends the use of Stop-Loss and Take-Profit, please speak to your Client Manager regarding their use.
*** You may wish to consider closing your position in profit, even if it is lower than suggested one
**** Trailing stop technique can protect the profit – Ask your Client Manager for more details