MID-TERM TREND: UP
HISTORCIAL CHANGES IN GOLD PRICES
|
Year |
December-31 |
January-31 |
Percentage Change |
|
2015 |
$1,184.04 |
$1,283.21 |
8.37% |
|
2016 |
$1,060.93 |
$1,116.65 |
5.25% |
|
2017 |
$1,152.01 |
$1,210.97 |
5.12% |
|
2018 |
$1,302.57 |
$1,345.09 |
3.26% |
|
2019 |
$1,281.89 |
$1,318.84 |
2.88% |
|
2020 |
$1,517.38 |
$1,589.00 |
4.72% |
|
2021 |
$1,900.33 |
$1,855.52 |
-2.36% |
|
Average Price Increase |
3.89% |
The table above tells us that gold prices historically rose in the period between December 31 and January 31. After calculating the average price changes over the same period starting 2015, we found an average increase of 3.89%.
However, please note that past performance does not guarantee future results.
- Safe-Haven Demand Expected Due to Covid-19 Worries: The Emergence of the OMICRON Variant
Virus cases are climbing in Europe and the U.S., and the U.K. to hit unseen high levels of daily infections. Scientists say OMICRON carries a high number of mutations in its spike protein, which plays a key role in the virus’ entry into cells in the body. According to UK officials, mutations are likely to evade immune response from vaccine and prior infections. This could trigger more restrictions, and therefore it could slow down the global economic activity. With that in mind, the safe-haven demand for Gold could increase.
- US Inflation at the highest since 1982: 6.8%
Inflation in the US has risen to the highest since 1982. The data for November showed a figure of 6.8%, much higher than the Fed’s target of 2.00%. Gold to be high in demand as it has been traditionally used by investors to protect from high inflation.
- Physical Demand for Gold to Rise in India and China
Physical demand for GOLD in China and India rises this period of the year (December, January, February) due to wedding festivals in India and Lunar New Year in China.
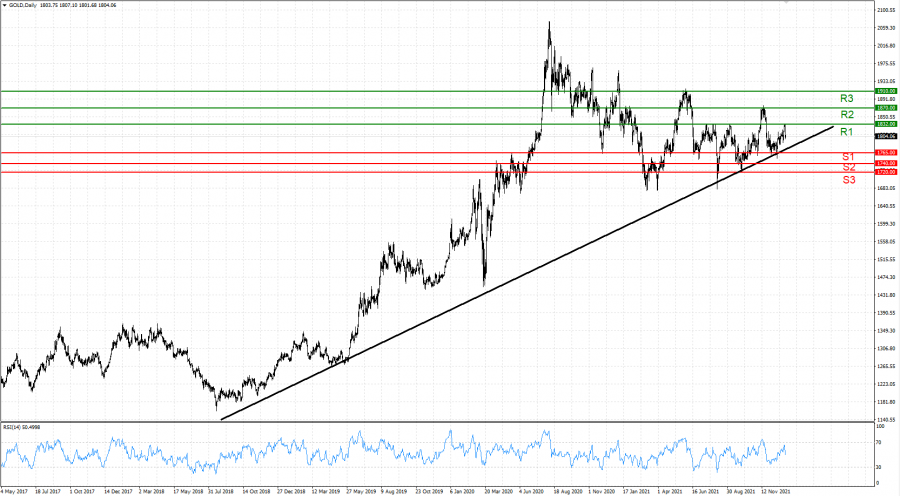
Graph: (Gold, Daily)
Current Price: 1798
|
GOLD |
Mid-Term |
|
Trend direction |
|
|
1910 |
|
|
1870 |
|
|
1832 |
|
|
1765 |
|
|
1740 |
|
|
1720 |
Example of calculation based on trend direction for 1.00 Lot*
|
GOLD |
||||||
|
Pivot Points |
||||||
|
Profit or loss in $ |
11,200.00 |
7,200.00 |
3,400.00 |
-3,300.00 |
-5,800.00 |
-7,800.00 |
|
Profit or loss in €** |
9,897.75 |
6,362.84 |
3,004.67 |
-2,916.30 |
-5,125.62 |
-6,893.08 |
|
Profit or loss in £** |
8,326.15 |
5,352.52 |
2,527.58 |
-2,453.24 |
-4,311.75 |
-5,798.57 |
|
Profit or loss in C$** |
14,342.94 |
9,220.46 |
4,354.11 |
-4,226.05 |
-7,427.60 |
-9,988.84 |
* 1.00 lot is equivalent of 100 units
** Calculations for exchange rate used as of 9:15 a.m. (GMT) 04/01/2022
Fortrade recommends the use of Stop-Loss and Take-Profit, please speak to your Client Manager regarding their use.
*** You may wish to consider closing your position in profit, even if it is lower than suggested one
**** Trailing stop technique can protect the profit – Ask your Client Manager for more details