WEEKLY TREND: UP
Fundamental Overview:
- PALLADIUM USE: Palladium finds use in car’s catalytic converters, meaning that if demand for cars rises, therefore, demand for Palladium could rise as well.
- INFLATIONS HEDGE: Amid rising inflation, investors turn to base and precious metals to hedge their wealth against rising inflation, which tends to eat away at their wealth. Inflation in the US showed a persistent increase of more than 5.00%, which tells the market participants that inflation increase is not transitory.
- MARKET DEFICIT: Analysts still believe that the Palladium markets will face a deficit of around 1 million ounces in 2021, which up from 2020’s 145,000 ounces.
Technical Overview:
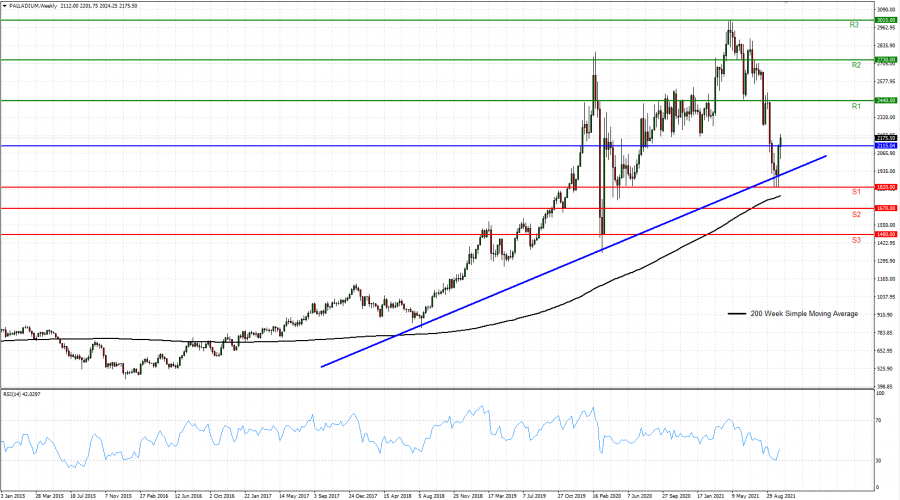
- PALLADIUM RECENT PRICE ACTION: Palladium has initially lost 1200 dollars (or around 41%) since May 2021, when it hit a fresh all-time high of $3015 per ounce. Palladium has recently fallen below the mark of 2000 to test its lowest rate since May 2020 ($1826.25). Palladium last traded around 2115, which would require a move of around 42% to its recent all-time high of 3015.
- LONG TERM UPTREND: Despite the most recent sell-off, Palladium managed to stay above its long term uptrend line. This could suggest an upward recovery as long as it stays above the uptrend (blue) lines. In addition, Palladium has also managed to stay above the 200-Week Simple Moving Average.
- 14-WEEK RELATIVE STRENGTH INDEX (RSI): The 14-Week RSI has fallen below the oversold threshold of 30, the lowest since 2016. This might signal a potential upward correction.
- RESISTANCE AND SUPPORT LEVELS: If Palladium manages to stay above the uptrend lines and speculators gather up to trade on 14-Week RSI oversold signal, then it might be expected the prices to start recovering, targeting Resistance 1 of 2440. If, however, the prices fail to stay above the uptrend lines, then it might be expected Palladium to continue falling and target Support 1 of 1820.
Graph: Palladium, Weekly
Current Price: 2115
|
PALLADIUM |
Weekly |
|
Trend direction |
|
|
3015 |
|
|
2730 |
|
|
2440 |
|
|
1820 |
|
|
1670 |
|
|
1480 |
Example of calculation based on weekly trend direction for 1.00 Lot*
|
PALLADIUM |
||||||
|
Profit or loss in $** |
90,000.00 |
61,500.00 |
32,500.00 |
-29,500.00 |
-44,500.00 |
-63,500.00 |
|
Profit or loss in € |
77,479.34 |
52,944.21 |
27,978.65 |
-25,396.01 |
-38,309.23 |
-54,665.98 |
|
Profit or loss in £** |
65,677.61 |
44,879.70 |
23,716.91 |
-21,527.66 |
-32,473.93 |
-46,339.20 |
|
Profit or loss in C$** |
111,549.60 |
76,225.56 |
40,281.80 |
-36,563.48 |
-55,155.08 |
-78,704.44 |
* 1.00 lot is equivalent of 100 units
** Calculations for exchange rate used as of 09:40 (GMT+1) 14/10/2021
Fortrade recommends the use of Stop-Loss and Take-Profit, please speak to your Client Manager regarding their use.
*** You may wish to consider closing your position in profit, even if it is lower than suggested one
**** Trailing stop technique can protect the profit – Ask your Client Manager for more details