WEEKLY TREND: UP
Soybean prices jumped in May to their highest since 2012 (1666.75) on supply disruptions, while higher demand continued to persist amid the ongoing Covid-19 Pandemic. The prices, however, have ever since retraced by around 21%.
Many analysts believe that the Soybean prices and their direction will be determined by the August weather which seems to bring about waves of drought and hot temperatures in the US, and without rainy days the expected crops yields should fall. This in turn could reduce supply and amid solid demand, this could support positively the Soybean prices.
Technical Overview:
- SIMPLE MOVING AVERAGE: Soybean has traded above the 50, 100 and 200 Weekly Simple Moving Average, which points to bullish index prices.
- 14-WEEK RELATIVE STRENGTH INDEX (RSI): The 14-Week RSI has recently fallen close the oversold threshold of 30, which indicates that Soybean has been closed to oversold as of late. This, in turn, signals a potential upward correction is imminent.
- RESISTANCE AND SUPPORT LEVELS: If Soybean manages to stay above the 50 Week Simple Moving Average, then it could be expected the prices to gradually continue rising, targeting Resistance 1 of 1410. If, however, the prices fail to stay above the 50 Week Simple Moving Average, then it could be expected Soybean to break below the mark of 1300 and target Support 1 of 1240.
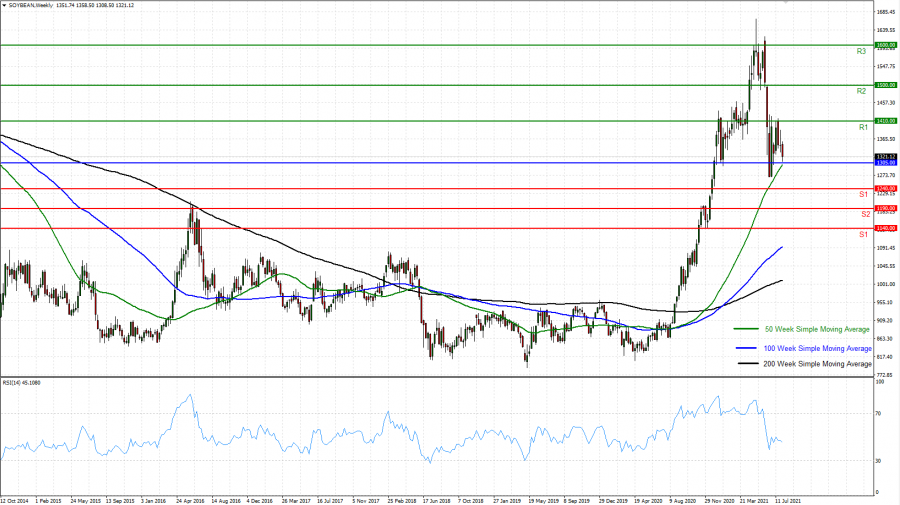
Graph: SOYBEAN, Weekly
Current Price: 1305
|
SOYBEAN |
Weekly |
|
Trend direction |
|
|
1600 |
|
|
1500 |
|
|
1410 |
|
|
1240 |
|
|
1190 |
|
|
1140 |
Example of calculation based on weekly trend direction for 1.00 Lot*
|
SOYBEAN |
||||||
|
Profit or loss in $** |
29,500.00 |
19,500.00 |
10,500.00 |
-6,500.00 |
-11,500.00 |
-16,500.00 |
|
Profit or loss in € |
24,900.82 |
16,459.86 |
8,863.00 |
-5,486.62 |
-9,707.10 |
-13,927.58 |
|
Profit or loss in £** |
21,195.57 |
14,010.63 |
7,544.19 |
-4,670.21 |
-8,262.68 |
-11,855.15 |
|
Profit or loss in C$** |
36,939.02 |
24,417.32 |
13,147.79 |
-8,139.11 |
-14,399.96 |
-20,660.81 |
* 1.00 lot is equivalent of 100 units
** Calculations for exchange rate used as of 13:20 (GMT+1) 05/08/2021
Fortrade recommends the use of Stop-Loss and Take-Profit, please speak to your Client Manager regarding their use.
*** You may wish to consider closing your position in profit, even if it is lower than suggested one
**** Trailing stop technique can protect the profit – Ask your Client Manager for more details