AMAZON (#AMAZON) weekly special report based on 1 Lot Calculation:
AMAZON: THE COMPANY
- Amazon is an American multinational technology company focusing on e-commerce, cloud computing, online advertising, digital streaming, and artificial intelligence. It has been referred to as "one of the most influential economic and cultural forces in the world.
- Amazon Web Services is a market leader with 34% of market share, ahead of Microsoft Azure (24%), Google Cloud (10%) and Alibaba Cloud (5%). The Cloud industry is expected to grow at a compounded annual growth rate at 17.9% until 2028, to $791.49B, with Amazon Web Services set to maintain dominance.
- STOCK INDEX PARTICIPATION: Amazon stock is a part of the NASDAQ 100 (USA 100) index, S&P 500 (USA500), and DOW 30 (USA30) index.
AMAZON: EVENTS
- EVENT (THURSDAY, FEBRUARY 5): Q4 2025 EARNINGS REPORT. AMAZON is expected to publish $211.47 billion in revenues, up 12.6% from the same period last year ($187.79 billion). The company is expected to release $31.08 billion in Net Income, up 55.4% from the same period last year ($20 billion).
- QUARTERLY REVENUE AND NET INCOME (LAST 8 QUARTERS). Amazon has beaten Revenue expectations 7 out of 8 times and Net Income expectations 8 out of the last 8 times.
- LAST TIME (Q3 RESULTS): Amazon reported higher-than-expected revenue ($180.17 billion, an increase of 13.4%) and better-than-expected Net income (21.19 billion, an increase of 38.2%). (Source: Bloomberg).
AMAZON: NEWS
- AWS LAUNCHED AWS EUROPEAN SOVEREIGN CLOUD (January 15), a new, independent cloud for Europe entirely located within the EU, and physically and logically separate from other AWS Regions. AWS plans to expand its AWS European Sovereign Cloud footprint from Germany across the EU. (Source: Amazon.com)
- AMAZON HAS ANNOUNCED PLANS TO CUT ABOUT 16,000 CORPORATE JOBS GLOBALLY. The move is expected to improve operational efficiency, reduce layers of management, and speed up decision-making, while freeing up capital to invest more aggressively in high-growth areas such as artificial intelligence, cloud computing, automation, and core retail operations. (Source: BBC)
AMAZON: PRICE ACTION:
- THE STOCK HIT AN ALL-TIME HIGH OF $258.38 ON NOVEMBER 3, 2025. The stock currently trades around $241, up around 4.5% since the beginning of 2026. However, the price could decline.
- ANALYSTS' OPINION: Wedbush forecasts $340. Citigroup forecasts $320. Morgan Stanley forecasts $315.
TECHNICAL ANALYSIS:
- MID-TERM UPTREND: Since April 2025, Amazon has been trending higher, guided by the rising black trendline. Each corrective phase has so far found support near this line, allowing the price to stabilize and resume its upward movement, indicating that the broader structure remains positive. However, the price could decline.
- KEY MOVING AVERAGES CONFIRM POSITIVE TREND: The 100-day moving average (green) continues to slope upward. Meanwhile, the 20-day moving average (red) has recently turned higher again after a brief pullback, suggesting that short-term momentum is recovering within the broader uptrend. However, the price could decline.
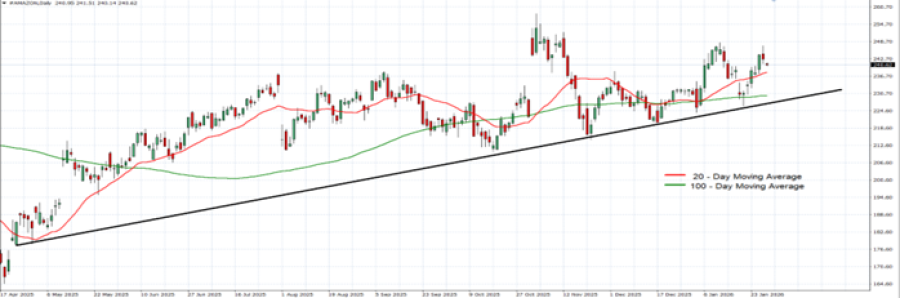
GRAPH (Daily): April 2025 - January 2026
Please note that past performance does not guarantee future results
#AMAZON, January 29, 2026
Current Price: 242
|
Amazon |
Weekly |
|
Trend direction |
|
|
340 |
|
|
300 |
|
|
260 |
|
|
224 |
|
|
220 |
|
|
215 |
Example of calculation based on weekly trend direction for 1.00 Lot1
|
Amazon |
||||||
|
Pivot Points |
||||||
|
Profit or loss in $ |
9,900 |
5,900 |
1,900 |
-1,700 |
-2,100 |
-2,600 |
|
Profit or loss in €² |
8,285 |
4,938 |
1,590 |
-1,423 |
-1,758 |
-2,176 |
|
Profit or loss in £² |
7,178 |
4,278 |
1,378 |
-1,233 |
-1,523 |
-1,885 |
|
Profit or loss in C$² |
13,417 |
7,996 |
2,575 |
-2,304 |
-2,846 |
-3,524 |
- 1.00 lot is equivalent of 100 units
- Calculations for exchange rate used as of 9:20 (GMT) 29/01/2026
There is a possibility to use Stop-Loss and Take-Profit.
- You may wish to consider closing your position in profit, even if it is lower than suggested one.
- Trailing stop technique could protect the profit.