Copper Weekly Special Report based on 1 Lot Calculation:
TECHNICAL ANALYSIS:
- WEEKLY MOVING AVERAGES POINT TO UPTREND: Copper prices have recently traded above the 20-, 50-, and 100-Week Moving Averages, pointing to an ongoing uptrend. However, Copper prices can also change their trend if prices fall below the 20-, 50-, and 100-Week Moving Averages.
- LONGER-TERM UPTREND CHANNEL: The black trend lines, describing the uptrend channel, are depicted on the chart below. Copper prices have maintained their uptrend in general since July 2022.
- RESISTANCE AND SUPPORT LEVELS: Copper has remained in an uptrend, looking at Resistance 1 of $5.30, Resistance 2 of $5.37, and Resistance 3 of $5.50 to the upside. On the downside, Copper looks at Support 1 of $4.95, then towards Support 2 of 4.90$, and Support 3 of $4.85.
- COPPER HIT AN ALL-TIME HIGH OF $5.3702 (March 26, 2025). Copper currently trades around $5.12, and if a full recovery takes place, then copper prices could see an upside of 4.30%. However, copper prices could decline as well.
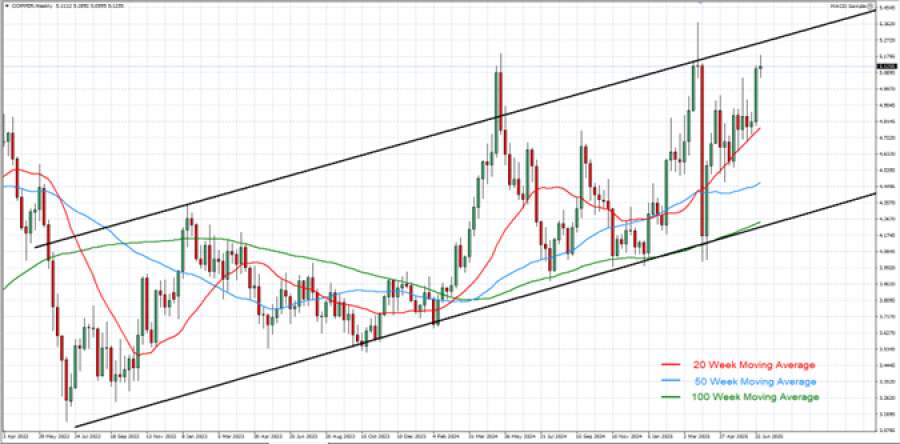
GRAPH (Weekly): April 2022 - July 2025
Please note that past performance does not guarantee future results
GEOPOLITICS: TRADE PROGRESS
- USA-CHINA TRADE DEAL SIGNED (JUNE 27): President Trump announced that the United States and China have officially signed a trade agreement, aiming to de-escalate tensions between the world’s two largest economies. For commodities, the agreement is particularly supportive of copper prices, as improved U.S.-China relations raise expectations for stronger Chinese industrial demand, especially in the construction and manufacturing sectors.
EVENTS (USA):
- THURSDAY, JULY 3, AT 13:30 GMT+1: US NONFARM PAYROLLS (NFP) AND UNEMPLOYMENT RATE (JUNE): In May, NFP came in at 139,000, while the unemployment rate held steady at 4.2%, the same as in April. If the unemployment rate continues its upward trend (4.0% in January, 4.1% in February, and 4.2% in March, April, and May), it could weaken the US dollar, potentially supporting higher copper prices. Also, a lower-than-expected NFP data increases expectations of future rate cuts, which tend to boost industrial metals like copper due to a weaker dollar.
EVENTS (CHINA):
- WEDNESDAY, JULY 9 AT 02:30 GMT+1: CHINA INFLATION (CPI) (JUNE): A higher-than-expected CPI reading may indicate strengthening domestic demand and economic activity in China, which could have a supportive effect on copper prices, given China's role as the world’s largest consumer of the metal. If inflation picks up from the previous reading of -0.1%, it could reinforce optimism about economic stabilization and increased commodity demand. (PREVIOUS: -0.1%)
- TUESDAY, JULY 15 AT 03:00 GMT+1: CHINA INDUSTRIAL PRODUCTION (JUNE): If June industrial data accelerates from May’s 5.8% growth, it would confirm continued momentum in factory activity, which is a major demand driver for copper. (PREVIOUS: +5.8%).
- TUESDAY, JULY 15 AT 03:00 GMT+1: CHINA GDP (Q2): A reading above the previous 5.4% growth would reinforce expectations of a stable economic rebound in the world’s largest copper consumer. Stronger GDP growth supports infrastructure spending, manufacturing activity, and overall commodity demand, lifting copper prices. (PREVIOUS: +5.4%)
COPPER, July 2, 2025
Current Price: 5.12
|
COPPER |
Weekly |
|
Trend direction |
|
|
5.50 |
|
|
5.37 |
|
|
5.30 |
|
|
4.95 |
|
|
4.90 |
|
|
4.85 |
Example of calculation based on weekly trend direction for 1.00 Lot1
COPPER
|
Pivot Points |
||||||
|
Profit or loss in $ |
3,800 |
2,500 |
1,800 |
-1,700 |
-2,200 |
-2,700 |
|
Profit or loss in €2 |
3,227 |
2,123 |
1,529 |
-1,444 |
-1,868 |
-2,293 |
|
Profit or loss in £2 |
2,774 |
1,825 |
1,314 |
-1,241 |
-1,606 |
-1,971 |
|
Profit or loss in C$2 |
5,186 |
3,412 |
2,457 |
-2,320 |
-3,003 |
-3,685 |
- 1.00 lot is equivalent of 10 000 units
- Calculations for exchange rate used as of 11:10 (GMT+1) 02/07/2025
There is a possibility to use Stop-Loss and Take-Profit
- You may wish to consider closing your position in profit, even if it is lower than the suggested one.
- Trailing stop technique could protect the profit