Copper Weekly Special Report based on 1 Lot Calculation:
GEOPOLITICS: US TARIFFS
- BREAKING (JULY 8): US PRESIDENT DONALD TRUMP SAID THEY WILL IMPOSE 50% TARIFFS ON COPPER IMPORTS, TAKING EFFECT WITHIN THE NEXT 30 DAYS. US President Trump said that tariffs are coming on copper, likely 50%, taking effect within the next 30 days.
- PRICE ACTION (JULY 8): COPPER PRICES JUMPED 17.49% TO HIT A NEW ALL-TIME HIGH ($5.89). The copper prices rose significantly as President Trump came up with a surprising 50% tariffs decision, which is against the previously planned 25%.
- LARGEST COPPER EXPORTERS TO THE U.S.A.: Chile, Canada and Mexico.
- IMPORTANCE: U.S.A. RELIES ON IMPORTS FOR 45% OF ITS COPPER CONSUMPTION. The U.S. relies on imports for 45% of its copper consumption, and a 50% tariff could disrupt supply chains. POTENTIAL IMPACT NEXT 30 DAYS: The decision caught a lot of manufacturers by surprise, which in turn could cause a panic stockpiling of copper before the tariffs start taking effect.
GEOPOLITICS: TRADE PROGRESS
- USA-CHINA TRADE DEAL SIGNED (JUNE 27): President Trump announced that the United States and China have officially signed a trade agreement, aiming to de-escalate tensions between the world’s two largest economies. For commodities, the agreement is particularly supportive of copper prices, as improved U.S.-China relations raise expectations for stronger Chinese industrial demand, especially in the construction and manufacturing sectors.
EVENTS (CHINA):
- TUESDAY, JULY 15 AT 03:00 GMT+1: CHINA INDUSTRIAL PRODUCTION (JUNE). If June industrial data accelerates from May’s 5.8% growth, it could confirm continued momentum in factory activity, which is a major demand driver for copper. (PREVIOUS: +5.8%).
- TUESDAY, JULY 15 AT 03:00 GMT+1: CHINA GDP (Q2). A reading above the previous 5.4% growth could reinforce expectations of a stable economic rebound in the world’s largest copper consumer. Stronger GDP growth supports infrastructure spending, manufacturing activity, and overall commodity demand, lifting copper prices. (PREVIOUS: +5.4%)
EVENTS (USA):
- TUESDAY, JULY 15 AT 13:30 GMT+1: US CONSUMER PRICE INDEX (CPI) (JUNE): A softer CPI reading below the previous +2.4% would boost expectations of earlier Fed rate cuts and improve the outlook for global growth. Easing monetary conditions tend to support industrial activity and commodity demand, supporting copper prices. (PREVIOUS: +2.4%).
TECHINICAL ANALYSIS:
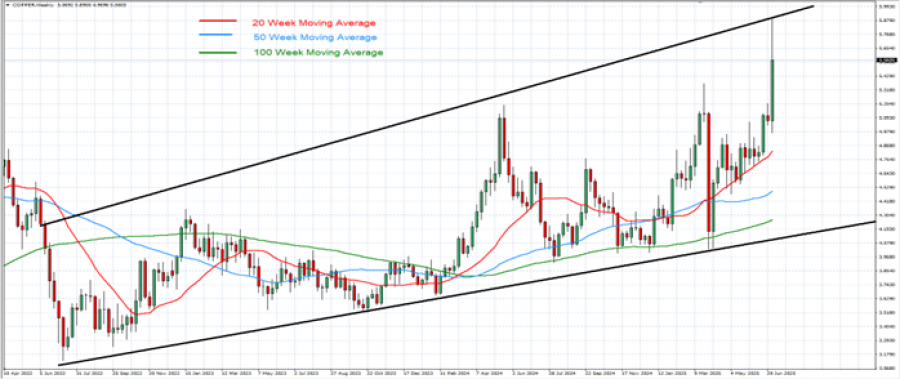
- WEEKLY MOVING AVERAGES POINT TO UPTREND: Copper prices have recently traded above the 20-, 50-, and 100-Week Moving Averages, pointing to an ongoing uptrend. However, Copper prices could also change their trend if prices fall below the 20-, 50-, and 100-Week Moving Averages.
- LONGER-TERM UPTREND CHANNEL: The black trend lines, describing the uptrend channel, are depicted on the chart below. Copper prices have maintained their uptrend in general since July 2022. However, there remains a risk of a potential breakout below this level if market conditions change.
- COPPER HIT AN ALL-TIME HIGH OF $5.89 (July 9, 2025). Copper currently trades around $5.50, and if a full recovery takes place, then copper prices could see an upside of 7%. However, copper prices could decline as well.
GRAPH (Weekly): April 2022 - July 2025
Please note that past performance does not guarantee future results
COPPER, July 9, 2025.
Current Price: 5.50
|
COPPER |
Weekly |
|
Trend direction |
|
|
7.00 |
|
|
6.50 |
|
|
5.90 |
|
|
5.15 |
|
|
5.10 |
|
|
5.00 |
Example of calculation based on weekly trend direction for 1.00 Lot1
COPPER
|
Pivot Points |
||||||
|
Profit or loss in $ |
15,000 |
10,000 |
4,000 |
-3,500 |
-4,000 |
-5,000 |
|
Profit or loss in €2 |
12,804 |
8,536 |
3,414 |
-2,988 |
-3,414 |
-4,268 |
|
Profit or loss in £2 |
11,032 |
7,355 |
2,942 |
-2,574 |
-2,942 |
-3,677 |
|
Profit or loss in C$2 |
20,525 |
13,683 |
5,473 |
-4,789 |
-5,473 |
-6,842 |
- 1.00 lot is equivalent of 10 000 units
- Calculations for exchange rate used as of 9:45 (GMT+1) 09/07/2025
There is a possibility to use Stop-Loss and Take-Profit
- You may wish to consider closing your position in profit, even if it is lower than the suggested one.
- Trailing stop technique could protect the profit