Copper Weekly Special Report based on 1 Lot Calculation:
COPPER USE AND MARKET SHARE:
- TOP COPPER PRODUCERS: The biggest producers of copper are: Chile (27% of the world total), China (8%), Peru (8%), the Democratic republic of Congo (6%), Australia (5%), Mexico (5%), Russia (3%), and Canada (2%).
- TOP COPPER CONSUMERS: The biggest consumers of copper are: China (52% of the world’s total), the United States (7%), The European Union (8%), and Japan (4%).
- TOP COPPER INDUSTRIES: Copper is heavily demanded in the EV industry, renewable energy industry (wind & solar farms), electrical infrastructure, telecommunications, and construction. The EV and green industries show the biggest growth rates (10-15% and 5%, respectively) and will push the overall copper growth rate higher in the future.
COPPER MARKET: TIGHT SUPPLY AND STRUCTURAL DEMAND SUPPORT 2026 OUTLOOK
- MARKET BALANCE: COPPER MARKET EXPECTED TO REMAIN TIGHT OR MOVE INTO DEFICIT IN 2026. Ongoing mine disruptions around the world, and declining ore grades continue to restrict supply growth, while demand remains supported by electrification and A.I. infrastructure needs.
- SUPPLY CONSTRAINTS: MINE OUTPUT LIMITED BY OPERATIONAL AND GEOPOLITICAL RISKS. Global copper supply remains heavily concentrated in Chile, Peru, and Indonesia where some of the largest copper mines in the world are still shut down, while at the same time water shortages, regulatory uncertainty, and labor disruptions continue to cap production growth, limiting the market’s ability to respond to rising demand.
- INDUSTRIAL DEMAND: ELECTRIFICATION AND A.I. INFRASTRUCTURE INVESTMENT UNDERPIN STRUCTURAL DEMAND. Copper demand remains structurally strong, supported by power grid expansion, renewable energy projects, A.I. Data centers construction, electric vehicles, and rising industrial activity, all reinforcing demand outlook into 2026.
EVENTS:
- WEDNESDAY, DECEMBER 31 AT 01:30 GMT: CHINA MANUFACTURING PURCHASING MANAGERS INDEX (PMI) (DECEMBER). A stronger-than-expected PMI reading would signal improving factory activity in China, the world’s largest consumer of copper. Rising manufacturing momentum would point to stronger demand from construction, power, and industrial sectors, supporting a bullish outlook for copper prices.
- WEDNESDAY, DECEMBER 31 AT 13:30 GMT: US INITIAL JOBLESS CLAIMS. Higher-than-expected jobless claims would suggest cooling labor market conditions, reinforcing expectations for Fed interest rate cuts and potentially supporting higher Copper prices.
- MONDAY, JANUARY 5 AT 15:00 GMT: ISM MANUFACTURING PURCHASING MANAGERS INDEX (PMI) (DECEMBER). A stronger-than-expected reading would support copper prices, as it would signal improving U.S. manufacturing activity and healthier industrial demand.
TECHNICAL ANALYSIS:
- UPTREND AND RECOVERY SINCE EARLY AUGUST 2025: Copper prices have traded within an uptrend channel since early August, as depicted by the daily chart below. However, there remains a risk of a potential breakout below this level if market conditions change.
- SUPPORT AREA: $5.30 – $5.20. This zone represents an important psychological support area for copper prices.
- COPPER PRICE HIT AN ALL-TIME HIGH OF $5.9552 (July 24, 2025): The copper price currently trades around $5.60, and if a full recovery occurs, then copper prices could see an upside of around 6.35%. Although the price could decline, too.
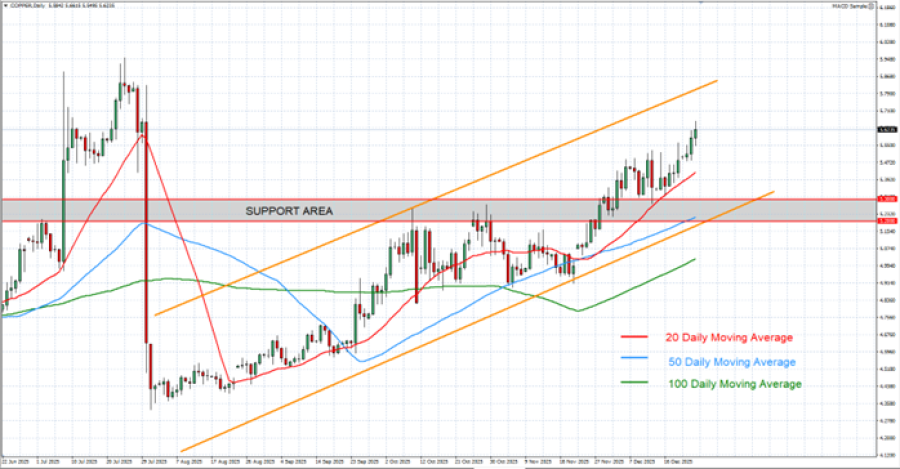
GRAPH (Daily): June 2025 - December 2025
Please note that past performance does not guarantee future results
COPPER, December 24, 2025.
Current Price: 5.600
|
COPPER |
Weekly |
|
Trend direction |
|
|
6.200 |
|
|
6.100 |
|
|
6.000 |
|
|
5.300 |
|
|
5.250 |
|
|
5.200 |
Example of calculation based on weekly trend direction for 1.00 Lot1
|
COPPER |
||||||
|
Pivot Points |
||||||
|
Profit or loss in $ |
6,000 |
5,000 |
4,000 |
-3,000 |
-3,500 |
-4,000 |
|
Profit or loss in €² |
5,085 |
4,238 |
3,390 |
-2,543 |
-2,966 |
-3,390 |
|
Profit or loss in £² |
4,437 |
3,698 |
2,958 |
-2,219 |
-2,588 |
-2,958 |
|
Profit or loss in C$² |
8,205 |
6,837 |
5,470 |
-4,102 |
-4,786 |
-5,470 |
- 1.00 lot is equivalent of 10 000 units
- Calculations for exchange rate used as of 10:41 (GMT) 24/12/2025
There is a possibility to use Stop-Loss and Take-Profit
- You may wish to consider closing your position in profit, even if it is lower than the suggested one.
- Trailing stop technique could protect the profit