Crude Oil weekly special report based On 1.00 Lot Calculation:
EVENTS:
- OPEC+ TO START CUTTING ITS OIL PRODUCTION BY AROUND 1,000,000 BARRELS A DAY FROM JANUARY 1, 2024. OPEC+, consisting of OPEC and some non- OPEC oil producers, is responsible for almost 50% of total global oil supply. The Organization of Petroleum Exporting Countries (OPEC), is led by Saudi Arabia, while non- OPEC part is led by Russia. The two players, accompanied by the other OPEC+ producers, agreed in early December 2023 additional oil production cuts that could start on January 1, 2024. Adding the previously agreed cuts, OPEC+ is expected now to deliver a total supply reduction of around 6 million barrels a day compared to November 2022. Favoring higher oil prices, both Saudi Arabia and Russia have said that if necessary the recently agreed cuts could be extended and/or expanded after Q1 of 2024.
- SAUDI ARABIA’S FISCAL BREAKEVEN OIL PRICE RANGES BETWEEN $80 AND $88 A BARREL. According to SPGLOBAL, Saudi Arabia needs a fiscal breakeven oil price ranging between $80 and $88 a barrel, based on estimates from the International Monetary Fund, Institute of International Finance and Goldman Sachs. In addition to that, the same source, earlier this year said that Russia would need a $114 a barrel fiscal breakeven oil price. FISCAL BREAKEVEN PRICE DEFINITION: According to the CFR.ORG, an oil-exporting country’s “fiscal breakeven” oil price is the minimum price per barrel that the country needs in order to meet its expected spending needs while balancing its budget. Oil prices below this level could result in budget deficits unless government policies change.
MIDDLE EAST TENSIONS TO KEEP MARKETS NERVOUS
- Middle East tensions, compounded by the ongoing Israeli ground offensive of Gaza Strip, keep many oil investors nervous. Meanwhile, the Yemen’s Houthis continue to pose a threat to the many ships transiting through the Red Sea. Some analyses show that around 9 million barrels a day of oil transits through the Red Sea. This is almost 10% of total global oil demand. Therefore, many investors fear the worst: oil delivery delays and higher oil prices thereafter. The Houthis have already claimed responsibility for many attacks on ships bound for Israel and have shown no signs of backing down.
ANALYST EXPECTATIONS 2024
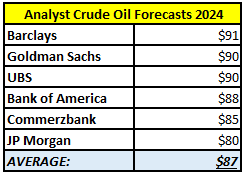
SOURCE: Bloomberg
TECHNICAL REVIEW:
- STATISTICS: CRUDE OIL HAS TESTED THE RANGE OF $62- $70 EIGHT TIMES SINCE FEBRUARY 2021. After testing the region, Crude oil would come back up above the mark of $70, to target the $80- $90 range.
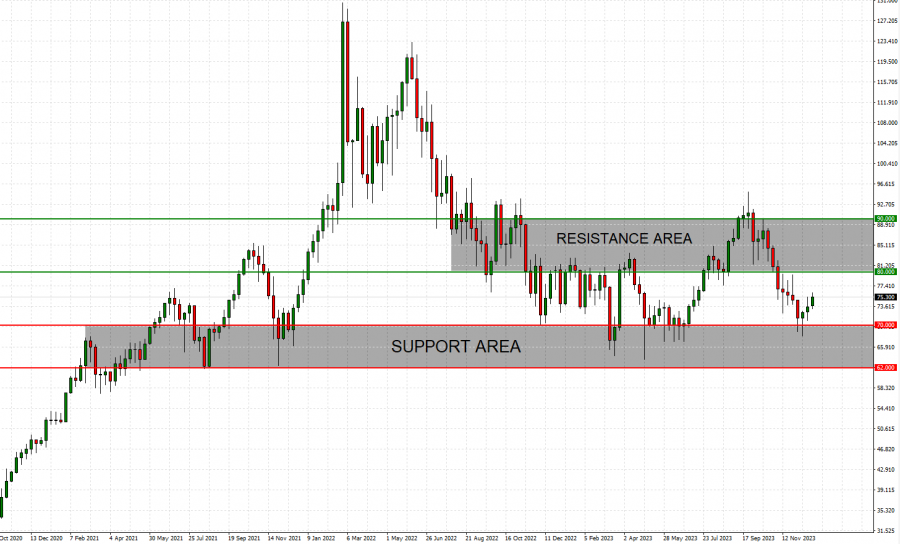
Graph (Weekly): Crude Oil (February 2021- December 2023)
Please note that past performance does not guarantee future results.
Crude Oil, December 27, 2023
Current Price:75
|
Crude Oil |
Weekly |
|
Trend direction |
|
|
100 |
|
|
90 |
|
|
80 |
|
|
70 |
|
|
69 |
|
|
68 |
Example of calculation base on weekly trend direction for 1.00 Lot1
|
Crude Oil |
||||||
|
Pivot Points |
||||||
|
Profit or loss in $ |
25,000 |
15,000 |
5,000 |
-5,000 |
-6,000 |
-7,000 |
|
Profit or loss in €2 |
22,631 |
13,579 |
4,526 |
-4,526 |
-5,432 |
-6,337 |
|
Profit or loss in £2 |
19,670 |
11,802 |
3,934 |
-3,934 |
-4,721 |
-5,507 |
|
Profit or loss in C$2 |
33,000 |
19,800 |
6,600 |
-6,600 |
-7,920 |
-9,240 |
1. 1.00 lot is equivalent of 1000 units
2. Calculations for exchange rate used as of 09:30 (GMT) 27/12/2023
Fortrade recommends the use of Stop-Loss and Take-Profit, please speak to your Senior Account ManagerClient Manager regarding their use.
- You may wish to consider closing your position in profit, even if it is lower than suggested one
- Trailing stop technique can protect the profit – Ask your Senior Account ManagerClient Manager for more detail