Crude Oil weekly special report based on 1.00 Lot Calculation:
TECHNICAL ANALYSIS:
- CRUDE OIL PRICES HAVE TESTED THEIR LOWEST LEVELS IN 16 MONTHS ON SEPTEMBER 10 ($65.255). Crude oil has remained under negative pressure trading around the mark of $66.5 on September, floating near its lowest rate since early May 2023.
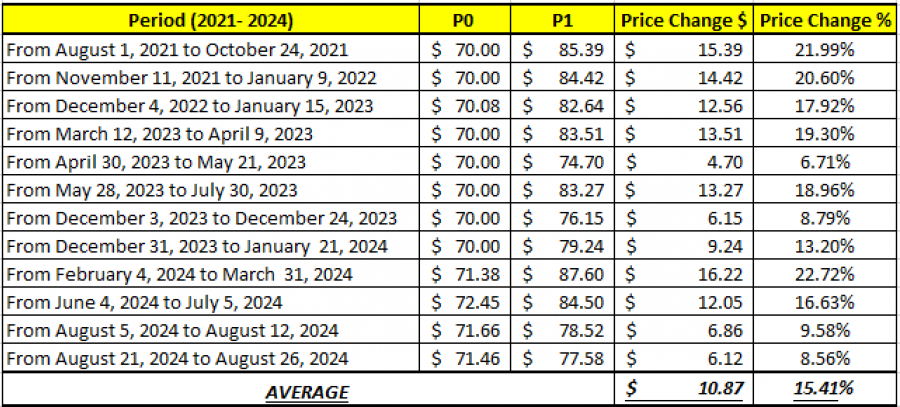
- CRUDE OIL PRICES HAVE TESTED THE MARK OF $70 (OR NEAR) 12 TIMES SINCE 2021. This is the 13th time that the Crude Oil prices are testing levels near the mark of $70.
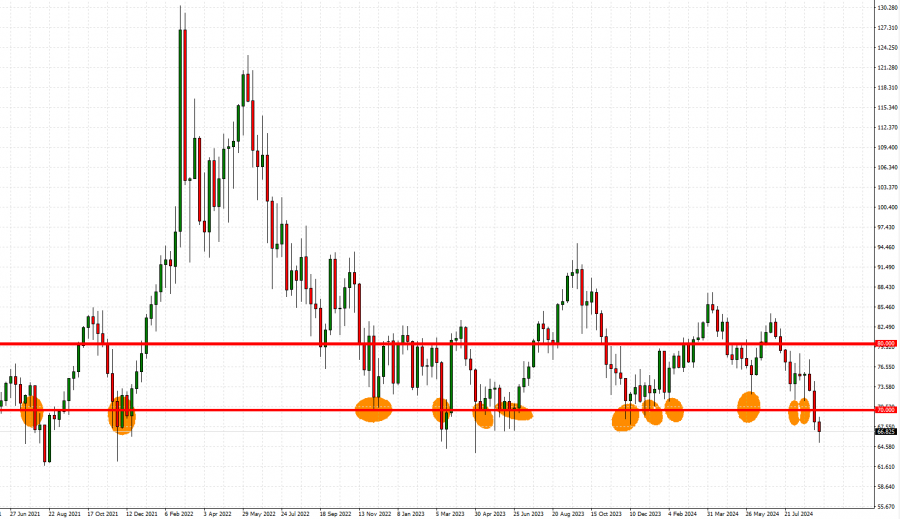
GRAPH (Daily): July 2021 – September 2024
Please note that past performance does not guarantee future results
- 2021- 2024 STATISTICS: CRUDE OIL TENDS TO RECOVER BY AROUND 15% AFTER TESTING THE MARK OF $70 OR NEAR IT.
DATA SOURCE: Fortrade MetaTrader 4
Please note that past performance does not guarantee future results
OIL MARKET EVENTS:
- WEDNESDAY, SEPTEMBER 11 AT 15:30 GMT+1: US WEEKLY OIL INVENTORIES DATA (US GOVERNMENT). If the inventories fall, the supply gets lower, which in turn could support positively the oil prices. Last time, the US Government reported a decline of 0.85 million barells.
ECONOMIC EVENTS:
- WEDNESDAY, SEPTEMBER 11 AT 13:30 GMT+1: US INFLATION (CPI) (AUGUST). US Inflaton rate currently stands at 2.9%. According to Bloomberg, August data on Wednesday should post a big decline to 2.5%. This could strengthen the case for aggressive interest rate cuts by the US Fed in the coming months, which could put negative pressure on the US Dollar, while Crude Oil prices could go up.
ANALYST OPINION:
Sources: Reuters, Bloomberg, Oilprice.com, CNBC
Please note that past performance does not guarantee future results
Crude Oil, September 11, 2024
Current Price: 66.50
|
Crude Oil |
Weekly |
|
Trend direction |
|
|
78.00 |
|
|
75.00 |
|
|
71.00 |
|
|
63.50 |
|
|
62.70 |
|
|
62.00 |
Example of calculation base on weekly trend direction for 1.00 Lot1
|
Crude Oil |
||||||
|
Pivot Points |
||||||
|
Profit or loss in $ |
11,500 |
8,500 |
4,500 |
-3,000 |
-3,800 |
-4,500 |
|
Profit or loss in €2 |
10,417 |
7,699 |
4,076 |
-2,717 |
-3,442 |
-4,076 |
|
Profit or loss in £2 |
8,792 |
6,499 |
3,440 |
-2,294 |
-2,905 |
-3,440 |
|
Profit or loss in C$2 |
15,629 |
11,552 |
6,116 |
-4,077 |
-5,164 |
-6,116 |
1. 1.00 lot is equivalent of 1000 units
2. Calculations for exchange rate used as of 09:20 (GMT+1) 11/09/2024
There is a possibility to use Stop-Loss and Take-Profit.
- You may wish to consider closing your position in profit, even if it is lower than the suggested one.
- Trailing stop technique could protect the profit.