CRUDE OIL Weekly Special Report based on 1 Lot Calculation:
TECHNICAL ANALYSIS:
- CHANNEL BETWEEN $60 AND $65 SINCE APRIL 2025. According to the daily chart below, the crude oil price has tended to predominantly trade in the channel between $60 and $65 since April 2025. The channel shows that after the crude oil price hits levels near $60 or below, it then tends to go back up. Conversely, when the crude oil price hits $65 or above, it then tends to go back down (Data Source: MetaTrader 4).
- BREAKING (OCTOBER 20): CRUDE OIL PRICES TESTED THE LEVELS OF $55.945. This was the third time the crude oil price tested levels below $60 and got near the mark of $55 (Data Source: MetaTrader 4).
- BREAKING (MAY 5): CRUDE OIL PRICES TESTED THE LEVEL OF $55.36. After testing the mark of $55.36, Crude oil prices managed to recover and hit $77.565 on June 13 (Data Source: MetaTrader 4).
- BREAKING (APRIL 9): CRUDE OIL PRICES HIT THEIR LOWEST LEVEL SINCE FEBRUARY 2021 ($55.115): Crude oil prices fell to their lowest in more than four years to hit the level of $55.115 on April 9. After testing the mark of $55.115, Crude oil prices managed to recover and hit $64.845 on April 23 (Data Source: MetaTrader 4).
- LONG-TERM SUPPORT AREA BELOW THE PSYCHOLOGICAL MARK OF $60: Crude oil price has recently tested levels below $60, which has been acting as a support area since early 2021. However, there remains a risk of a potential breakout below this level if market conditions change.
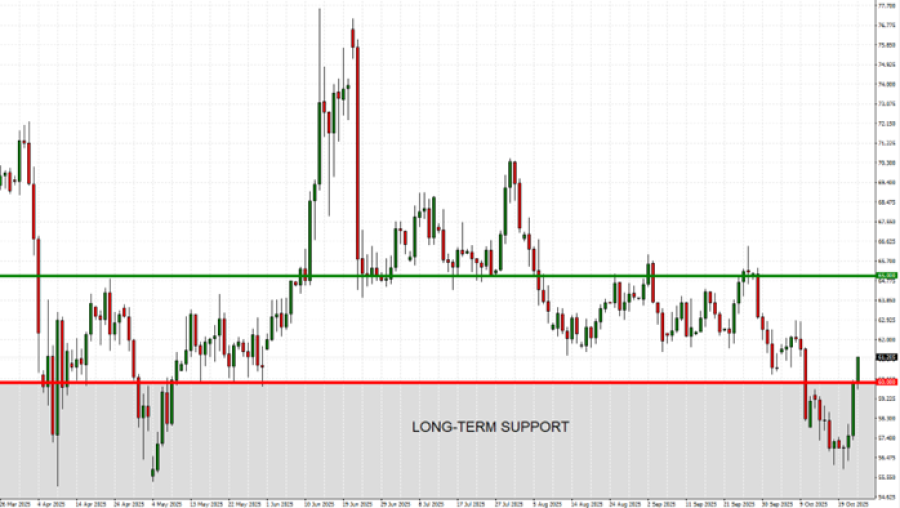
GRAPH (Daily): March 2025 – October 2025
Please note that past performance does not guarantee future results
GEOPOLITICS: UKRAINE – RUSSIA CONFLICT
- BREAKING NEWS (OCTOBER 22): U.S.A. ANNOUNCED OIL SANCTIONS ON RUSSIA. According to the BBC, the USA announced sanctions targeting the largest Russian oil producers and exporters, Rosneft and Lukoil. Both companies together export around 3.1 million barrels a day, or around 60% of total Russian oil exports per day. In addition, Rosneft is responsible for around 50% of total Russian oil output, or 5%-6% of total global output.
- BREAKING (OCTOBER 21): TRUMP-PUTIN PLANNED SUMMIT HAS BEEN CANCELLED. Reuters reported, a planned summit between U.S. President Donald Trump and Russian President Vladimir Putin was put on hold.
GEOPOLITICS: CHINA – USA TRADE
- EVENT (OCTOBER 31 – NOVEMBER 1): US PRESIDENT TRUMP AND CHINA PRESIDENT XI MEETING. The meeting is expected to take place at the APEC (Asia-Pacific Economic Cooperation) Summit, which will take place between October 31 and November 1 in South Korea. De-escalating trade tensions between the two largest oil consumers in the world could support the oil demand outlook.
EVENTS (ECONOMIC DATA):
- FRIDAY, OCTOBER 24, AT 13:30 GMT+1: US INFLATION (CPI) (SEPTEMBER). Despite the ongoing US government shutdown, latest reports have said that US inflation data could still be released, with the office workers expected to work harder to get the data out. In August, US inflation rose to 2.90%, up from July’s 2.70%. This would be the last inflation report before the Fed’s interest rate decision on October 29.
- WEDNESDAY, OCTOBER 29, AT 19:00 GMT+1: US FEDERAL RESERVE INTEREST RATE DECISION. After cutting rates from 4.50% to 4.25% in September 2025, the Fed is expected to again cut rates in October. This time, the bank is expected to cut rates down to 4.00%.
Crude Oil, October 23, 2025.
Current Price: 61.20
|
Crude Oil |
Weekly |
|
Trend direction |
|
|
68.00 |
|
|
66.00 |
|
|
64.00 |
|
|
58.50 |
|
|
58.00 |
|
|
57.00 |
Example of calculation based on weekly trend direction for 1.00 Lot1
|
Crude Oil |
||||||
|
Pivot Points |
||||||
|
Profit or loss in $ |
6,800 |
4,800 |
2,800 |
-2,700 |
-3,200 |
-4,200 |
|
Profit or loss in €² |
5,865 |
4,140 |
2,415 |
-2,329 |
-2,760 |
-3,623 |
|
Profit or loss in £² |
5,094 |
3,596 |
2,098 |
-2,023 |
-2,397 |
-3,147 |
|
Profit or loss in C$² |
9,515 |
6,717 |
3,918 |
-3,778 |
-4,478 |
-5,877 |
- 1.00 lot is equivalent of 1000 units
- Calculations for exchange rate used as of 09:00 (GMT+1) 23/10/2025
There is a possibility to use Stop-Loss and Take-Profit.
- You may wish to consider closing your position in profit, even if it is lower than the suggested one.
- Trailing stop techniques could protect the profit.