Crude Oil weekly special report based on 1.00 Lot Calculation:
TECHNICAL ANALYSIS
- BREAKING (DECEMBER 16): CRUDE OIL HAS TESTED ITS LOWEST RATE SINCE FEBRUARY 2021 ($54.865). The crude oil price has tested its lowest rate since February 2021.
- TECHNICAL SUPPORT: $55. According to the daily chart below, crude oil has tested levels near $55 four times since 2021.
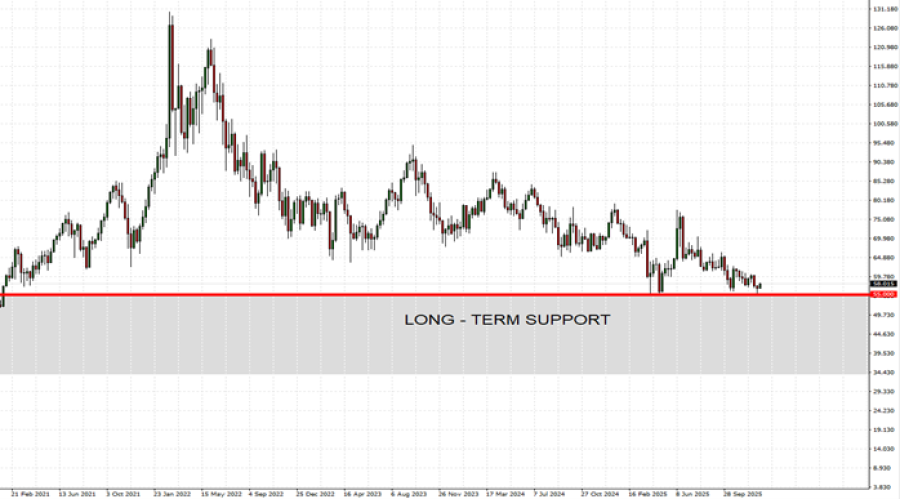
GRAPH (Weekly): February 2021 – December 2025
Please note that past performance does not guarantee future results
BREAK-EVEN OIL PRICE ANALYSIS (NEW WELLS AND EXISTING WELLS): U.S.A.
- AVERAGE PRICE FOR FIRMS TO BE PROFITABLE (DRILLING NEW WELLS): $65. This is the average price of oil for oil producers to be profitable drilling new oil wells.
- AVERAGE PRICE FOR FIRMS TO BE PROFITABLE (EXISTING WELLS): $41. This is the average price of oil for oil producers to be profitable maintaining existing oil wells.
- AVERAGE BREAKEVEN PRICE (NEW AND EXISTING WELLS): $53. This is the average price of oil for oil producers to be profitable drilling new oil wells and maintaining existing oil wells.
Source: dallasfed.org
GEOPOLIITICS: USA - VENEZUELA CONFLICT
- BREAKING (DECEMBER 20 - 21): U.S.A. CAPTURED AND SEIZED SECOND AND THIRD VENEZUELA OIL TANKER. According to Reuters, U.S. President Donald Trump has announced a total and complete blockade of sanctioned Venezuelan oil tankers.
- BREAKING (DECEMBER 10): THE UNITED STATES HAS SEIZED ONE LARGE OIL TANKER CARRYING VENEZUELAN OIL UNDER U.S. SANCTIONS, marking the first such confiscation. In addition, according to Reuters, the USA has imposed sanctions on six more tankers linked to Venezuelan oil exports, increasing risks for maritime shipments.
- VENEZUELA CURRENT OIL EXPORT: AROUND 1 MILLION BARRELS A DAY. Most of it goes to China, Turkey and some to India and Iran.
EVENTS:
- TUESDAY, DECEMBER 23 AT 21:30 GMT: AMERICAN PETROL INSTITUTE (API) OIL INVENTORY DATA (USA). If data showed a declining inventory for the past week, then positive support for the oil price could be expected. However, the price could decline.
- WEDNESDAY, DECEMBER 24 AT 15:30 GMT: ENERGY INFORMATION ADMINISTRATION (EIA) OIL INVENTORY DATA (USA). If data showed a declining inventory for the past week, then positive support for the oil price could be expected. However, the price could decline.
- WEDNESDAY, DECEMBER 31 AT 1:30 GMT: CHINA MANUFACTURING PMI (DECEMBER). Manufacturing PMI provides an early indication each month of economic activities in the Chinese manufacturing sector. In November this indicator showed an increase from 49 to 49.2. China is the second world's largest oil consumer.
Crude Oil, December 23, 2025.
Current Price: 57.90
|
Crude Oil |
Weekly |
|
Trend direction |
|
|
65.00 |
|
|
63.00 |
|
|
61.00 |
|
|
55.00 |
|
|
54.50 |
|
|
54.00 |
Example of calculation based on weekly trend direction for 1.00 Lot1
|
Crude Oil |
||||||
|
Pivot Points |
||||||
|
Profit or loss in $ |
7,100 |
5,100 |
3,100 |
-2,900 |
-3,400 |
-3,900 |
|
Profit or loss in €² |
6,023 |
4,327 |
2,630 |
-2,460 |
-2,884 |
-3,309 |
|
Profit or loss in £² |
5,255 |
3,775 |
2,295 |
-2,147 |
-2,517 |
-2,887 |
|
Profit or loss in C$² |
9,735 |
6,993 |
4,250 |
-3,976 |
-4,662 |
-5,347 |
- 1.00 lot is equivalent of 1000 units
- Calculations for exchange rate used as of 09:00 (GMT) 23/12/2025
There is a possibility to use Stop-Loss and Take-Profit.
- You may wish to consider closing your position in profit, even if it is lower than suggested one.
- Trailing stop technique could protect the profit.