Crude Oil weekly special report based on 1.00 Lot Calculation:
GEOPOLITICAL TENSIONS RISE: MIDDLE-EAST
- EVENT (FRIDAY, FEBRUARY 6 AT 06:00 A.M. GMT): IRAN – U.S. NUCLEAR TALKS IN OMAN ARE STILL ON THE AGENDA DESPITE U.S. THREATS TO WITHDRAW FROM THE TALKS. According to Reuters, White House envoys Steve Witkoff and Jared Kushner will meet Iranian foreign minister Abbas Araghchi in Oman on Friday morning. The plans to hold a meeting between the US and Iran in Oman on Friday to discuss a nuclear deal are back on track, after several Arab and Muslim leaders applied urgent pressure on the Trump administration on Wednesday afternoon not to carry out the threats to withdraw from the talks.
- BREAKING (LATE JANUARY - EARLY FEBRUARY): THE US “ARMADA” OF SHIPS ARRIVED IN THE MIDDLE EAST NEAR IRAN, A STRONG INDICATION OF POSSIBLE ESCALATION. The United States had previously directed the USS Abraham Lincoln and its carrier strike group to redeploy toward the Middle East. At the same time, the USS Roosevelt destroyer, equipped with advanced air-defense capabilities, has been positioned to help protect U.S. bases in the region from potential Iranian attacks. This development represents one of the most significant U.S. air power buildups in the region in recent years.
IRANIAN OIL PRODUCTION AT RISK: Iran is one of the top three oil producers within OPEC, along with Saudi Arabia and Iraq, producing around 4 million barrels of oil per day, which is around 4% of total global supply.
IRAN OIL EXPORTS AT RISK: Iran exports around 1.7 million barrels of oil per day, predominantly to China.
STRAIT OF HORMUZ AT RISK: KEY OIL SUPPLY ROUTE. The Strait of Hormuz is a critical energy chokepoint through which around 20% of global crude oil demand passes, mainly from Saudi Arabia, Kuwait, and Iran. Rising tensions with Iran increase the risk that Tehran could attempt to block or disrupt traffic through the strait, which would significantly tighten global oil supply and add upside pressure to oil prices.
Source: Reuters, CNBC, Bloomberg
OTHER GEOPOLITICS: RUSSIA-UKRAINE CONFLICT
- EVENT (WEDNESDAY AND THURSDAY, FEBRUARY 4 - 5): ANOTHER ROUND OF A TRI-LATERAL SUMMIT BETWEEN THE USA, UKRAINE AND RUSSIA BEGAN TAKING PLACE IN THE UNITED ARAB EMIRATES, WITH MAIN STICKING POINTS STILL BEING AN ISSUE. According to Reuters, delegations from Russia, Ukraine and the United States began trilateral talks in the UAE. The previous talks of the trilateral working group on security issues in Abu Dhabi, capital of the UAE, lasted two days, namely from Jan 23-24. The main sticking point is the long-term fate of territory in eastern Ukraine, large parts of which Russia has occupied. Moscow is demanding that Kyiv pull its troops out of swaths of the Donbas, including heavily fortified cities that sit atop vast natural resources, as a condition of any deal.
Source: Reuters, CNBC, Bloomberg
TECHNICAL ANALYSIS
- SUPPORT AREA: $55 - $60. According to the weekly chart below, crude oil has tested levels between $55 and $60 five times since 2021.
- BREAKING (DECEMBER 16, 2025): CRUDE OIL HAS TESTED ITS LOWEST RATE SINCE FEBRUARY 2021 ($54.865). The crude oil price has tested its lowest rate since February 2021. Currently, crude oil is trading above the $60 mark, floating above its longer-term support area between $55 and $60.
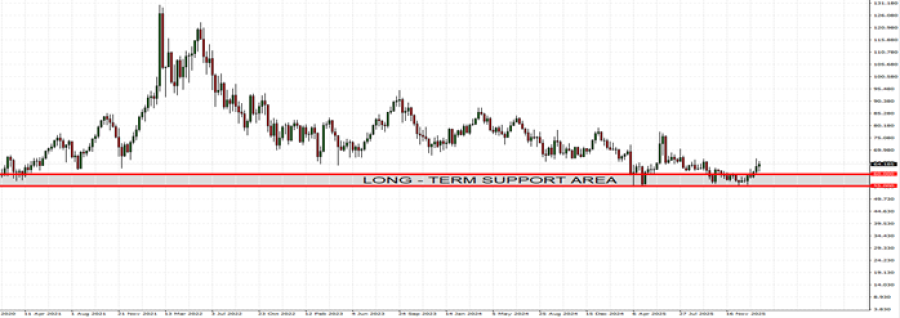
GRAPH (Weekly): December 2020 – February 2026
Please note that past performance does not guarantee future results
Crude Oil, February 5, 2026
Current Price: 64.10
|
Crude Oil |
Weekly |
|
Trend direction |
|
|
75.00 |
|
|
71.00 |
|
|
68.00 |
|
|
61.00 |
|
|
60.50 |
|
|
60.00 |
Example of calculation based on weekly trend direction for 1.00 Lot1
|
Crude Oil |
||||||
|
Pivot Points |
||||||
|
Profit or loss in $ |
10,900 |
6,900 |
3,900 |
-3,100 |
-3,600 |
-4,100 |
|
Profit or loss in €² |
9,227 |
5,841 |
3,301 |
-2,624 |
-3,047 |
-3,471 |
|
Profit or loss in £² |
7,950 |
5,033 |
2,844 |
-2,261 |
-2,626 |
-2,990 |
|
Profit or loss in C$² |
14,879 |
9,419 |
5,324 |
-4,232 |
-4,914 |
-5,597 |
- 1.00 lot is equivalent of 1000 units
- Calculations for exchange rate used as of 08:50 (GMT) 05/02/2026
There is a possibility to use Stop-Loss and Take-Profit.
- You may wish to consider closing your position in profit, even if it is lower than suggested one.
- Trailing stop technique could protect the profit.