CRUDE OIL Weekly Special Report based on 1 Lot Calculation:
GEOPOLIITICS: MIDDLE EAST
- MIDDLE EAST WAR. The Supreme Leader of Iran, Ali Khamenei, was killed in the first wave of strikes on Saturday. More than 40 other high-ranking leaders were also killed over the weekend. Iran retaliated by launching rockets and striking U.S. air bases and its allies in the region: Israel, Kuwait, Bahrain, U.A.E., Qatar, Jordan, Saudi Arabia, Iraq, and at least two rockets hit U.K. military bases in Cyprus.
THE STRAIT OF HORMUZ IS “CLOSED.” Iranian forces said they will not allow ships to pass through the strait. According to the latest reports, at least three tankers have been hit and damaged near the Strait of Hormuz.
OIL AND NATURAL GAS MARKET IMPACT: More than 20 million barrels of oil pass through it daily, representing more than 20% of total global demand.
IRAN OIL PRODUCTION (AROUND 4 MILLION BARRELS A DAY) AND OIL EXPORTS (AROUND 1.7 MILLION BARRELS A DAY) AT RISK: Iran is one of the top three oil producers within OPEC, along with Saudi Arabia and Iraq.
- HOUTHIS IN YEMEN THREATEN TO STRIKE ALL SHIPS CROSSING THE RED SEA. 12–15% of total global trade passes through the Red Sea route and 20–25% of Europe–Asia trade.
- SAUDI ARABIA SHUT ITS BIGGEST DOMESTIC OIL REFINERY, SAUDI ARAMCO'S RAS TANURA, AFTER A DRONE STRIKE. It is one of the world’s largest oil refineries, producing over 550,000 barrels a day, and is a major oil export hub.
- ENERGY FACILITIES IN QATAR TARGETED BY DRONE AND MISSILE ATTACKS. Qatar’s Ministry of Defence confirmed that two separate missile and drone attacks targeted major energy-related facilities in the country.
Source: Reuters, CNBC, Bloomberg
TECHNICAL ANALYSIS
- DAILY MOVING AVERAGES CONFIRM POSITIVE MOMENTUM: The 50-day moving average (red) is trending higher, indicating strengthening short-term momentum. The 100-day moving average (green) is also rising and remains below the current crude oil price, reinforcing the broader positive structure. With price trading above both moving averages, the overall sentiment remains positive.
- UPTREND STRUCTURE REMAINS INTACT: The ascending trend line (black) continues to hold, confirming the medium-term uptrend. Recent pullbacks have respected the trend line, highlighting strong underlying demand. As long as crude oil remains above these dynamic support levels, the outlook stays constructive with potential for further upside.
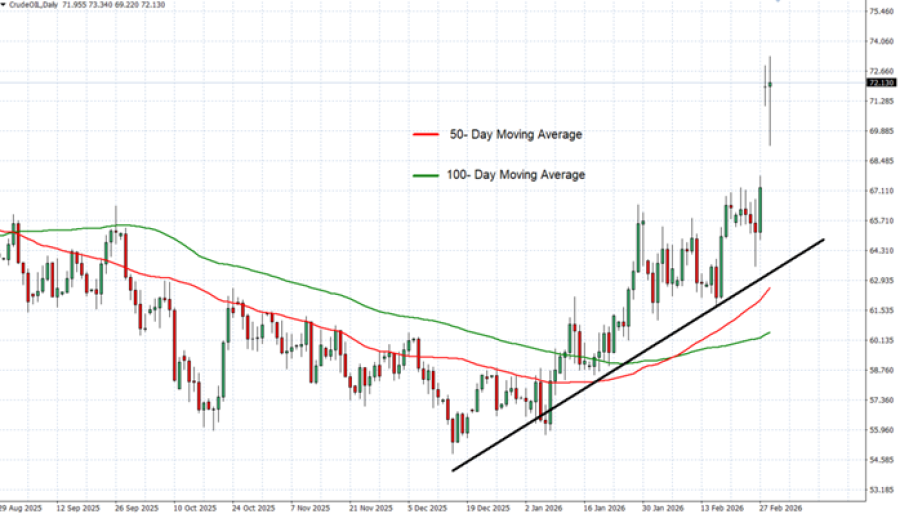
GRAPH (Daily): August 2025 – March 2026
Please note that past performance does not guarantee future results
Crude Oil, March 2, 2026
Current Price: 72.24
|
Crude Oil |
Weekly |
|
Trend direction |
|
|
100.00 |
|
|
90.00 |
|
|
80.00 |
|
|
68.00 |
|
|
65.00 |
|
|
63.00 |
Example of calculation based on weekly trend direction for 1.00 Lot1
|
Crude Oil |
||||||
|
Pivot Points |
||||||
|
Profit or loss in $ |
27,760 |
17,760 |
7,760 |
-4,240 |
-7,240 |
-9,240 |
|
Profit or loss in €² |
23,662 |
15,138 |
6,615 |
-3,614 |
-6,171 |
-7,876 |
|
Profit or loss in £² |
20,704 |
13,246 |
5,788 |
-3,162 |
-5,400 |
-6,891 |
|
Profit or loss in C$² |
37,913 |
24,256 |
10,598 |
-5,791 |
-9,888 |
-12,620 |
- 1.00 lot is equivalent of 1000 units
- Calculations for exchange rate used a 12:05 (GMT) 2/3/2026
There is a possibility to use Stop-Loss and Take-Profit.
- You may wish to consider closing your position in profit, even if it is lower than the suggested one.
- Trailing stop techniques could protect the profit.