EUR/USD Weekly Special Report Based on 1 Lot Calculation:
GEOPOLIITICS: MIDDLE EAST
- EVENT (SATURDAY, FEBRUARY 28): STRAIT OF HORMUZ CLOSED. Iranian forces announced that vessels will not be allowed to transit the Strait of Hormuz. According to the latest reports, at least four oil tankers have been struck and damaged near the strait, escalating tensions in the region.
IMPACT ON THE EURO: Approximately 5% of the oil transported through the Strait of Hormuz is destined for Europe, representing roughly 10% of total European oil imports. In addition, Qatar accounts for up to 14% of Europe’s total LNG imports as of early 2026, increasing the region’s vulnerability to supply disruptions. (Source: IEA)
IMPACT ON THE U.S. DOLLAR: The U.S. dollar continues to strengthen on safe-haven demand, as the conflict, initially centered between the United States and Iran, appears to be spreading to neighboring countries, heightening geopolitical uncertainty.
EVENTS:
- FRIDAY, MARCH 6 AT 10:00 GMT: GDP IN EUROZONE (Q4). A preliminary report published in February showed a fall from 1.4% to 1.3% compared to the same period of last year. Analysts expect preliminary results will be confirmed this time as well.
- FRIDAY, MARCH 6 AT 13:30 GMT: NONFARM PAYROLLS (NFP) AND UNEMPLOYMENT RATE (FEBRUARY) IN THE U.S. The US labor market data remains one of the most important indicators used by the U.S. Fed, which could potentially predict when new interest rate cuts may be implemented. In January the unemployment rate fell from 4.4% to 4.3% while NonFarm Payrolls jumped from 48,000 to 130,000.
TECHNICAL ANALYSIS
- DAILY MOVING AVERAGES: MOMENTUM TURNING LOWER. EUR/USD has moved below the 20-day moving average (red), showing that short-term direction has turned downward. The pair is now testing the 100-day moving average (green). If it stays below this level, it would confirm that negative pressure is increasing.
- DOWNWARD STRUCTURE. Since late January, the pair has been forming lower highs. The descending trendline (orange) continues to act as resistance, limiting recovery attempts. However, the price can also increase.
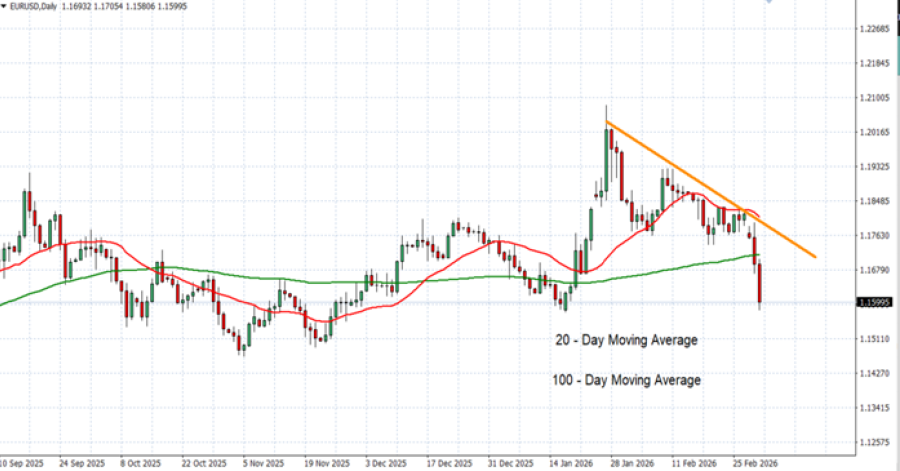
GRAPH (Daily): September 2025– March 2026
Please note that past performance does not guarantee future results
EUR/USD, March 3, 2026
Current Price: 1.15950
|
EUR/USD |
Weekly |
|
Trend direction |
|
|
1.1900 |
|
|
1.1800 |
|
|
1.1690 |
|
|
1.1485 |
|
|
1.1350 |
|
|
1.1150 |
Example of calculation based on weekly trend direction for 1.00 Lot1
|
EUR/USD |
||||||
|
Pivot Points |
||||||
|
Profit or loss in $ |
-3,050 |
-2,050 |
-950 |
1,100 |
2,450 |
4,450 |
|
Profit or loss in €² |
-2,630 |
-1,768 |
-819 |
949 |
2,113 |
3,837 |
|
Profit or loss in £² |
-2,294 |
-1,542 |
-715 |
828 |
1,843 |
3,348 |
|
Profit or loss in C$² |
-3,959 |
-2,661 |
-1,233 |
1,428 |
3,181 |
5,777 |
- 1.00 lot is equivalent of 100 000 units
- Calculations for exchange rate used as of 12:00 (GMT) 03/03/2026
There is a possibility to use Stop-Loss and Take-Profit
- You may wish to consider closing your position in profit, even if it is lower than the suggested one.
- Trailing stop technique could protect the profit