Gasoline weekly special report based On 1.00 Lot Calculation:
GEOPOLIITICS: MIDDLE EAST
- MIDDLE EAST WAR. The Supreme Leader of Iran, Ali Khamenei, was killed in the first wave of strikes on Saturday. More than 40 other high-ranking leaders were also killed over the weekend. Iran retaliated by launching rockets and striking U.S. air bases and its allies in the region: Israel, Kuwait, Bahrain, U.A.E., Qatar, Jordan, Saudi Arabia, Iraq, and at least two rockets hit U.K. military bases in Cyprus.
THE STRAIT OF HORMUZ IS “CLOSED.” Iranian forces said they will not allow ships to pass through the strait. According to the latest reports, at least three tankers have been hit and damaged near the Strait of Hormuz.
OIL AND NATURAL GAS MARKET IMPACT: More than 20 million barrels of oil pass through it daily, representing more than 20% of total global demand.
IRAN OIL PRODUCTION (AROUND 4 MILLION BARRELS A DAY) AND OIL EXPORTS (AROUND 1.7 MILLION BARRELS A DAY) AT RISK: Iran is one of the top three oil producers within OPEC, along with Saudi Arabia and Iraq.
KUWAIT CUTS OIL PROCESSING AT ITS REFINERIES. Kuwait has cut processing rates at its three oil refineries, and the reduction could be extended further in the next few days if needed. The reduction is due to storage availability. Kuwait used to produce around 3.2 million barrels a day and export up to 2 million barrels a day.
AFTER IRAQ AND KUWAIT, U.A.E. COULD SOON ANNOUNCE A PAUSE IN OIL PROCESSING AND PRODUCTION. The United Arab Emirates may be next to reduce output if they cannot export crude through the Strait of Hormuz due to the Iran crisis, as storage tanks fill up, according to analysts, traders and sources. U.A.E. used to produce around 3.4 million barrels a day and export up to 3 million barrels a day.
TECHNICAL ANALYSIS
- DAILY MOVING AVERAGES CONFIRM POSITIVE MOMENTUM: The 50-day moving average (blue) is trending higher, indicating strengthening short-term momentum. The 100-day moving average (green) is also rising and remains below the current crude oil price, reinforcing the broader positive structure. With price trading above both moving averages, the overall sentiment remains positive.
- UPTREND STRUCTURE REMAINS INTACT: The ascending trend line (black) continues to hold, confirming the medium-term uptrend. Recent pullbacks have respected the trend line, highlighting strong underlying demand. As long as crude oil remains above these dynamic support levels, the outlook stays constructive with potential for further upside.
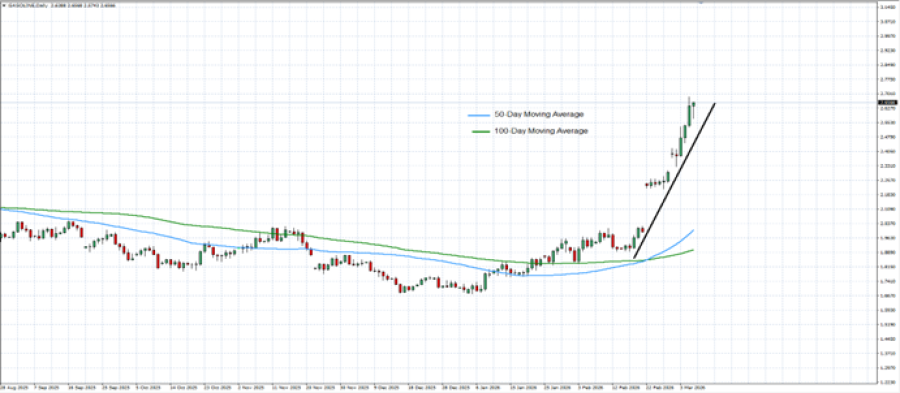
GRAPH (Daily): August 2025 – March 2026
Please note that past performance does not guarantee future results
Gasoline, March 6, 2026
Current Price: 2.690
|
Gasoline |
Weekly |
|
Trend direction |
|
|
3.500 |
|
|
3.200 |
|
|
2.900 |
|
|
2.500 |
|
|
2.450 |
|
|
2.400 |
Example of calculation base on weekly trend direction for 1.00 Lot1
|
GASOLINE |
||||||
|
Pivot Points |
||||||
|
Profit or loss in $ |
81,000 |
51,000 |
21,000 |
-19,000 |
-24,000 |
-29,000 |
|
Profit or loss in €2 |
69,980 |
44,062 |
18,143 |
-16,415 |
-20,735 |
-25,055 |
|
Profit or loss in £2 |
60,787 |
38,273 |
15,759 |
-14,259 |
-18,011 |
-21,763 |
|
Profit or loss in C$2 |
110,695 |
69,697 |
28,699 |
-25,965 |
-32,798 |
-39,631 |
- 1.00 lot is equivalent of 100.000 units
- Calculations for exchange rate used as of 10:00 (GMT) 6/3/2025
There is a possibility to use Stop-Loss and Take-Profit.
- You may wish to consider closing your position in profit, even if it is lower than suggested one.
- Trailing stop technique could protect the profit.