GBP/USD Weekly Special Report based on 1.00 Lot Calculation:
EVENTS USA:
- WEDNESDAY, FEBRUARY 11 AT 13:30 GMT: U.S. NONFARM PAYROLLS (NFP) AND UNEMPLOYMENT RATE (JANUARY): Weaker-than-expected job growth or a rise in the unemployment rate would reinforce expectations for Federal Reserve rate cuts. A softer labor market could weigh on the U.S. dollar and support further upside in GBP/USD.
- FRIDAY, FEBRUARY 13 AT 13:30 GMT: US INFLATION DATA (CPI) (JANUARY): A lower-than-expected inflation reading would reinforce expectations for Federal Reserve rate cuts. With U.S. headline CPI currently at 2.7%, down from recent highs near 3%, further easing in price pressures could weigh on the dollar and support continued upside in GBP/USD.
- FRIDAY, FEBRUARY 20 AT 13:30 GMT: US GROSS DOMESTIC PRODUCT (GDP) (Q4): A softer-than-expected Q4 GDP reading would raise expectations for Federal Reserve rate cuts as growth momentum slows. Weaker U.S. growth may pressure the dollar and support further upside in GBP/USD.
EVENTS UNITED KINGDOM:
- THURSDAY, FEBRUARY 12 AT 7:00 GMT: UK GROSS DOMESTIC PRODUCT (GDP) (Q4). A stronger-than-expected Q4 growth reading would reinforce confidence in the UK economic outlook. Signs of improving momentum could support the pound and push GBP/USD higher.
- TUESDAY, FEBRUARY 17 AT 7:00 GMT: UK UNEMPLOYMENT RATE (DECEMBER). A stable or lower unemployment rate would point to resilience in the UK labor market. Strong employment conditions could support the pound and add upward momentum to GBP/USD.
- WEDNESDAY, FEBRUARY 18 AT 7:00 GMT: UK INFLATION (CPI) (JANUARY). A stronger inflation reading would ease pressure on the Bank of England to cut rates quickly, so a higher-than-expected CPI could lift the pound and support an uptrend in GBP/USD.
TECHNICAL ANALYSIS:
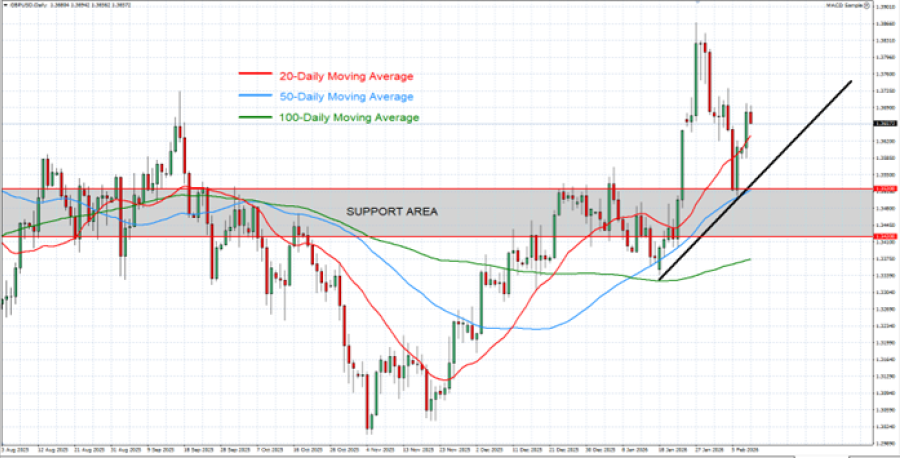
- CURRENT UPTREND (SINCE JANUARY 2026): The black trend line, describing the uptrend, is depicted on the chart below. The GBP/USD currency pair has tested levels around 1.33 in January, and since then, it has been moving above this uptrend line. However, there remains a risk of a potential breakout below this level if market conditions change.
- 20-, 50-, AND 100-DAILY MOVING AVERAGE POINT TO UPTREND: GBP/USD currency pair has recently traded above the 20-, 50-, and 100-Daily Moving Average, pointing to an ongoing uptrend. However, this trend can also change if prices fall below the 20-, 50-, and 100-Daily Moving Average.
- SUPPORT AREA: 1.3420 – 1.3520. This zone represents its next support area for GBP/USD currency pair.
 GRAPH (Daily): August 2025 – February 2026
Please note that past performance does not guarantee future results
GBPUSD, February 10, 2026
Current Price: 1.3660
|
GBP/USD |
Weekly |
|
Trend direction |
|
|
1.4170 |
|
|
1.3970 |
|
|
1.3820 |
|
|
1.3520 |
|
|
1.3470 |
|
|
1.3420 |
Example of calculation based on weekly trend direction for 1.00 Lot1
|
GBP/USD |
||||||
|
Pivot Points |
||||||
|
Profit or loss in $ |
5,100 |
3,100 |
1,600 |
-1,400 |
-1,900 |
-2,400 |
|
Profit or loss in €² |
4,281 |
2,602 |
1,343 |
-1,175 |
-1,595 |
-2,015 |
|
Profit or loss in £² |
3,731 |
2,268 |
1,170 |
-1,024 |
-1,390 |
-1,756 |
|
Profit or loss in C$² |
7,170 |
4,358 |
2,249 |
-1,968 |
-2,671 |
-3,374 |
- 1.00 lot is equivalent of 100.000 units
- Calculations for exchange rate used as of 10:25 (GMT) 10/2/2026
There is a possibility to use Stop-Loss and Take-Profit.
- You may wish to consider closing your position in profit, even if it is lower than suggested one.
- Trailing stop technique could protect the profit.