Gold weekly special report based On 1.00 Lot Calculation:
Historical Changes in Gold Prices
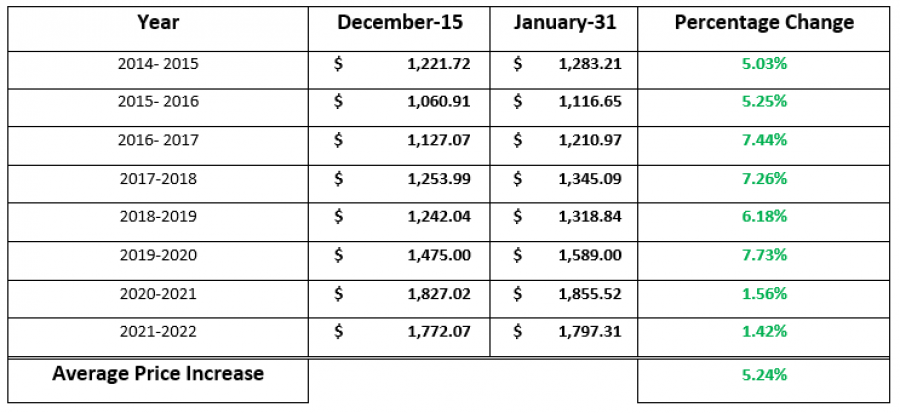
The table above tells us that gold prices historically rose in the period between December 15 and January 31. After calculating the average price changes over the same period starting 2014-2015, we found an average increase of 5.24%.
However, please note that past performance does not guarantee future results.
- EVENT: United States Non-Farm Payrolls (NFP) and Unemployment Rate, for December (January 6th, 2023, 13:30 GMT)- The NFP is expected to fall to 207,000, while the unemployment rate is forecast to remain unchanged at 3.7%.
- EVENT: United States Consumer Price Index, CPI, for December (January 12th, 2023, 13:30 GMT)- October’s CPI figures came in historically high with the top line printing at 7.1%, Year-over-Year, and core inflation at 6.0%, year-over-year. The consensus forecast, at the time of this writing, is a decrease to 6.7% and 5.7% respectively.
- EVENT: U.S. Federal Reserve Meeting and Interest Rate Decision (February 1st, 2023, 19:00 GMT)- The Federal Open Market Committee will complete their 2-day meeting on February 1st and announce changes to the Federal Funds Rate target. The subsequent press conference by Chairman Jerome Powell will serve as a harbinger of how aggressive the U.S. central bank will be with respect to future rate hikes. Futures markets currently forecast a 69.3% chance of a 25 basis point hike on February 1st.
- NEWS: The World Gold Council reported that central banks bought 399 tons of Gold in the 3rd quarter of 2022. Through the first 9 months of 2022, central banks have bought more Gold than any year since 1967.
- ANALYSTS OPINION: Goldman Sachs’ six-month price target is $1,950. Citigroup forecasts $1,900. Bank of America set $2,000 as its 2023 price target for Gold.
- GOLD PRICE ACTION: Gold reached $2070.06 in early 2022.
GOLD, January 4th, 2023
Current Price:1,860.00
|
Gold |
Weekly |
|
Trend direction |
|
|
2,100.00 |
|
|
2,000.00 |
|
|
1,930.00 |
|
|
1,800.00 |
|
|
1,750.00 |
|
|
1,700.00 |
Example of calculation base on weekly trend direction for 1.00 Lot1
|
Pivot Points |
||||||
|
Profit or loss in $ |
24,000.00 |
14,000.00 |
7,000.00 |
-6,000.00 |
-11,000.00 |
-16,000.00 |
|
Profit or loss in €2 |
22,579.73 |
13,171.51 |
6,585.76 |
-5,644.93 |
-10,349.05 |
-15,053.16 |
|
Profit or loss in £2 |
19,862.62 |
11,586.53 |
5,793.26 |
-4,965.65 |
-9,103.70 |
-13,241.74 |
|
Profit or loss in C$2 |
32,637.60 |
19,038.60 |
9,519.30 |
-8,159.40 |
-14,958.90 |
-21,758.40 |
1. 1.00 lot is equivalent of 100 units
2. Calculations for exchange rate used as of 08:17 (GMT) 04/01/2023
Fortrade recommends the use of Stop-Loss and Take-Profit, please speak to your Senior Account ManagerClient Manager regarding their use.
- You may wish to consider closing your position in profit, even if it is lower than suggested one.
- Trailing stop technique can protect the profit – Ask your Senior Account ManagerClient Manager for more details.