GOLD weekly special report based on 1.00 Lot Calculation:
TECHNICAL ANALYSIS:
- SUPPORT AREA BETWEEN $3,350 AND $3,300: Gold prices have seen near-term support at $3,350, and extended support level at $3,300, meaning the area between $3,350 AND $3,300 altogether acts as near-term support.
- DAILY MOVING AVERAGES POINT TO AN UPTREND: Gold prices have been trading above the 20- and 50-day moving Averages, pointing to an ongoing uptrend. However, gold prices can also change their trend if prices fall below the 20- and 50-day moving Averages.
- MID–TERM UPTREND LINE: As depicted by the daily chart below, the gold price has kept trading above the mid-term black uptrend line, confirming the current trend is up.
- GOLD HIT A NEW ALL-TIME HIGH OF $3,499.76 (April 22, 2025). Gold has traded around $3,390, and if a full recovery takes place, the price of Gold could rise around $110. Although the price could decline as well.
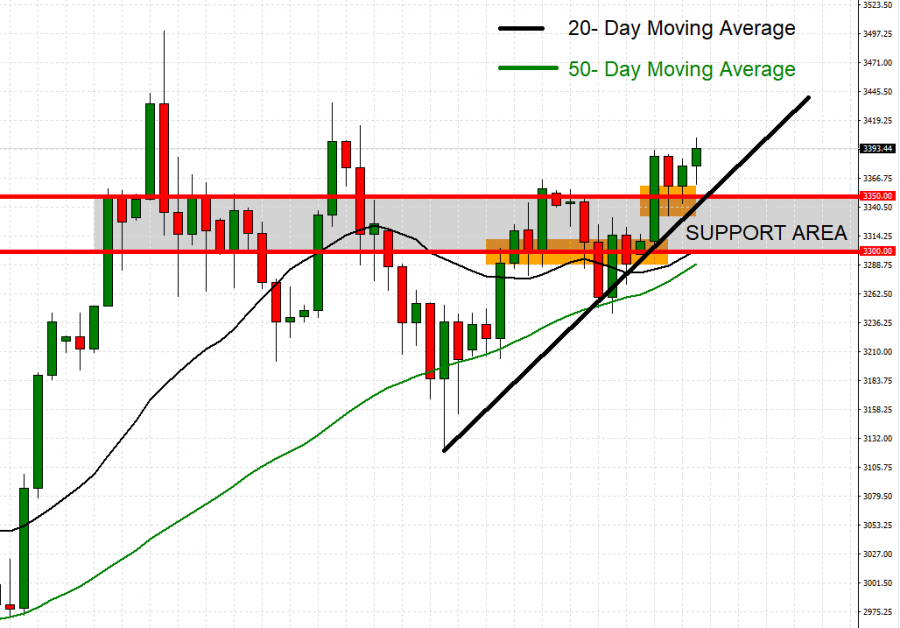
GRAPH (Daily): April 2025 – June 2025
Please note that past performance does not guarantee future results
EVENTS:
- FRIDAY, JUNE 6, AT 13:30 GMT+1: US NON-FARM PAYROLL (NFP) AND UNEMPLOYMENT RATE (MAY): A lower-than-expected NFP reading could be taken as positive for the gold price, because a weaker US economy could exert negative pressures on the US dollar. This data measures the change in the number of people employed during the previous month, excluding the farming industry. The data for the previous month stood at 177,000, which is lower than for the month before (228,000).
GEOPOLITICS:
- RUSSIA – UKRAINE POTENTIAL PEACE AGREEMENT IN JEOPARDY AS RUSSIA’S PRESIDENT PUTIN PREPARES FOR RETALIATION. Uncertainties remain high even after President Trump and President Putin's phone calls on May 19 and June 4, as no breakthroughs have been announced. The phone calls happened after rounds of unsuccessful talks between Russia and Ukraine in Istanbul, Turkey, on May 16 and June 2, where there were no signs of a major breakthrough either. Meanwhile, Russian President Putin said they will have to respond to recent Ukrainian attacks on Russia's fleet of bombers on the ground inside Russia.
- US – IRAN NUCLEAR TALKS IN JEOPARDY: MIDDLE EAST TENSIONS RISE AS NO CONCRETE DEALS HAVE BEEN MADE BETWEEN THE USA AND IRAN. The US said it has sent a new proposal to Iran, which is expected to be rejected by Iran, putting the nuclear talks in jeopardy. The latest round of talks between the US and Iran in Rome, Italy, brought no concrete agreements. Iran is still insisting on continuing its uranium enrichment program, while the USA wants zero uranium enrichment from Iran. The next and sixth round of talks is expected to take place sometime in June.
ANALYSTS’ OPINION:
- CITIGROUP has a price target of $3,500
- J.P. MORGAN has a price target of $3,675.
- GOLDMAN SACHS has a price target of $3,700.
- UBS has a price target of $3,500.
Source: Reuters, Bloomberg, CNBC
GOLD, June 5, 2025
Current Price: 3,390
|
GOLD |
Weekly |
|
Trend direction |
|
|
3,600 |
|
|
3,500 |
|
|
3,440 |
|
|
3,345 |
|
|
3,320 |
|
|
3,300 |
Example of calculation base on weekly trend direction for 1.00 Lot1
|
GOLD |
||||||
|
Pivot Points |
||||||
|
Profit or loss in $ |
21,000 |
11,000 |
5,000 |
-4,500 |
-7,000 |
-9,000 |
|
Profit or loss in €2 |
18,388 |
9,632 |
4,378 |
-3,940 |
-6,129 |
-7,881 |
|
Profit or loss in £2 |
15,478 |
8,107 |
3,685 |
-3,317 |
-5,159 |
-6,633 |
|
Profit or loss in C$2 |
28,686 |
15,026 |
6,830 |
-6,147 |
-9,562 |
-12,294 |
- 1.00 lot is equivalent of 100 units
- Calculations for exchange rate used as of 12:30 (GMT+1) 05/06/2025
There is a possibility to use Stop-Loss and Take-Profit.
- You may wish to consider closing your position in profit, even if it is lower than suggested one.
- Trailing stop technique could protect the profit.