GOLD weekly special report based on 1.00 Lot Calculation:
STATISTICS (2025):
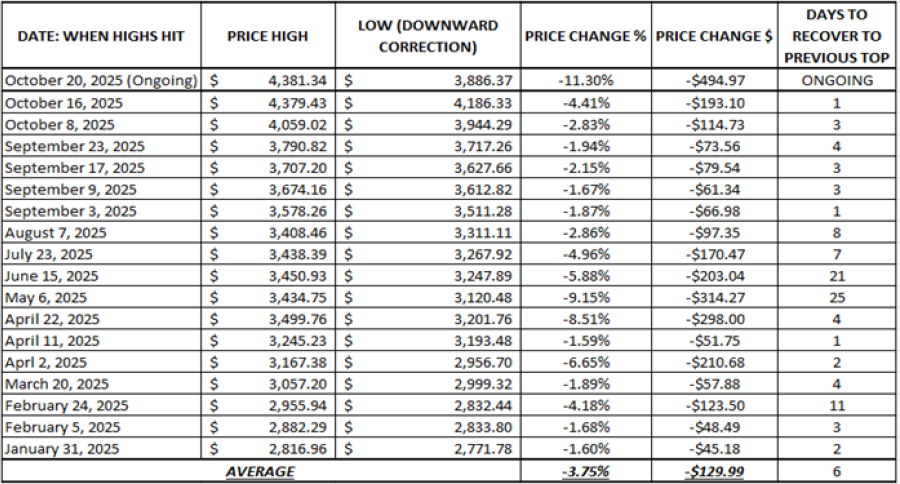
- STATISTICS (2025): GOLD HAS UNDERGONE 17 DOWNWARD CORRECTIONS IN 2025, FOLLOWED BY PRICE RECOVERIES TO PREVIOUS TOPS.
- AVERAGE NUMBER OF DAYS NEEDED TO RECOVER TO PREVIOUS TOP: 6
- CURRENT: THE CURRENT DOWNWARD CORRECTION IS THE 18TH THIS YEAR. Since October 20, 2025, gold has lost around $495 after testing $3,886.37 on October 28, 2025.
- TECHNICAL SUPPORT: $4,100 - $4,000. Over the past few days, after the most recent decline in gold prices, gold has tried to maintain near-term support between $4,100 and $4,000.
- GOLD HIT AN ALL-TIME HIGH OF $4,381.34 (October 20, 2025): Gold has traded last around $4,233, and if a full recovery to its recent all-time high takes place, then gold could see an upside potential of around $150. Despite the recent price correction, gold is still up more than 60% since the beginning of 2025.
Data Source: Meta Trader 4
Please note that past performance does not guarantee future results
US FEDERAL RESERVE:
- BREAKING (OCTOBER 29): US FEDERAL RESERVE CUT INTEREST RATE TO 4.00% FROM 4.25%. The Fed cut rates again in October after the one earlier in September. In total, this year, rates have fallen from 4.50% to the current 4.00%.
- NEXT: DECEMBER 10: The US Federal Reserve is expected to finish the year 2025 by cutting the rates to 3.75% on December 10.
GEOPOLITICS: US PRESIDENT TRUMP ANNOUNCED STIMULUS CHECKS FOR US CITIZENS?
- BREAKING (NOVEMBER 9): U.S. PRESIDENT TRUMP PROMISED $2,000 TARIFF DIVIDEND TO MOST AMERICANS. President Trump said a dividend of at least $2000 a person (not including high-income people!) will be paid to everyone. President Trump will use the high tariff revenue to distribute stimulus checks to most Americans in the form of a tariff dividend.
- POTENTIAL CONSEQUENCES: POTENTIALLY $360 BILLION TO BE INJECTED BACK INTO THE US ECONOMY. If the US administration distributed $2,000 checks to at least 180 million Americans, it would mean that $360 billion could re-enter the US economy in the form of spending and consumption. This would increase the money supply significantly, put negative pressure on the US dollar, pushing investors towards safer instruments such as gold or silver.
- LAST TIME US GOVERNMENT STARTED DISTRIBUTING STIMULUS CHECKS (MARCH -APRIL 2020): GOLD PRICES ROSE 12.02%. Back on March 17, 2020, the US administration announced the first of three stimulus check rounds, which kicked in already in April 2020. It was worth $1,200. From March 17, 2020, to April 30, 2020, gold prices rose to $1,687.85 from $1,506.69, marking an increase of 12.02%.
Please note that past performance does not guarantee future results
PRICE ACTION:
- ANALYSTS’ OPINION: Bank of America forecasts $5,000; Societe Generale forecasts $5,000; Standard Chartered forecasts $4,500; Goldman Sachs forecasts $4,900; J.P. Morgan forecasts $5,055; Morgan Stanley forecasts $4,400; HSBC forecasts $5,000.
GOLD, November 13, 2025.
Current Price: 4,233
|
GOLD |
Weekly |
|
Trend direction |
|
|
4,700 |
|
|
4,500 |
|
|
4,380 |
|
|
4,100 |
|
|
4,050 |
|
|
4,000 |
Example of calculation base on weekly trend direction for 1.00 Lot1
|
GOLD |
||||||
|
Pivot Points |
||||||
|
Profit or loss in $ |
46,700 |
26,700 |
14,700 |
-13,300 |
-18,300 |
-23,300 |
|
Profit or loss in €2 |
40,217 |
22,994 |
12,659 |
-11,454 |
-15,760 |
-20,066 |
|
Profit or loss in £2 |
35,521 |
20,309 |
11,181 |
-10,116 |
-13,920 |
-17,723 |
|
Profit or loss in C$2 |
65,347 |
37,361 |
20,570 |
-18,611 |
-25,607 |
-32,604 |
- 1.00 lot is equivalent of 100 units
- Calculations for exchange rate used as of 10:00 (GMT) 13/11/2025
There is a possibility to use Stop-Loss and Take-Profit.
- You may wish to consider closing your position in profit, even if it is lower than suggested one.
- Trailing stop technique could protect the profit.