GOLD weekly special report based on 1.00 Lot Calculation:
SOUTH AMERICA GEOPOLITICAL TENSIONS ESCALATE
- BREAKING (JANUARY 3): US ARMY ATTACKS VENEZUELA WITH AIRSTRIKES, CAPTURING VENEZUELAN PRESIDENT MADURO AND HIS WIFE. According to Reuters, after a coordinated land and air strike the US military captured President Maduro and his wife, with Maduro set to appear in court on Monday (January 5) on charges of drug trafficking. US President Trump has threatened harsh punishments to the new interim leader Delcy Rodriguez if compliance with US is ignored.
- BREAKING (JANUARY 3): US PRESIDENT TRUMP THREATENS COLOMBIA AS WELL. US President Trump laid out a possibility of a similar intervention happening in Colombia, accusing the state and its President Gustavo Pero of producing and exporting narcotics to the US.
EVENTS:
- WEDNESDAY, JANUARY 7 AT 13:15 GMT: US ADP NONFARM EMPLOYMENT CHANGE (DECEMBER). A lower-than-expected reading could be positive for Gold because it will indicate a worsening situation in the labor market, with the FED having more incentive to intervene by lowering interest rates, thus potentially supporting Gold.
- THURSDAY, JANUARY 8 AT 13:30 GMT: US INITIAL JOBLESS CLAIMS. A higher-than-expected reading will indicate a deteriorating situation in the US labor market, which could motivate the FED to continue its interest rate cut cycle in 2026, possibly supporting gold prices. This data measures the number of individuals who filed for unemployment insurance for the first time during the past week. The data for last week came in at 199,000.
- FRIDAY, JANUARY 9 AT 13:30 GMT: NON-FARM PAYROLLS AND UNEMPLOYMENT RATE (DECEMBER). A lower-than-expected reading could be positive for Gold because it will indicate a worsening situation in the labor market, with the FED having more incentive to intervene by lowering interest rates, thus potentially supporting Gold. This category measures the number of people employed during the previous month, excluding the farming industry. The data for last month came in at 64,000.
PRICE ACTION
- GOLD RECOVERS AFTER A PULL BACK. Since the beginning of 2025, gold has had 18 downward corrections, taking on average 8 days to recover to previous top. The current price of Gold stands around $4,423, and if it recovers to its all-time highs ($4,550.17), it could potentially rise by around 127 dollars. However, it could also decline.
Data Source: Meta Trader 4
Please note that past performance does not guarantee future results
- GOLD PRICE HIT A NEW ALL-TIME HIGH ON DECEMBER 26, 2025 ($4,550.17). Since the beginning of 2025, the gold price has been rising solidly, hitting a fresh all-time high in December ($4,550.17), marking an increase of around 73%. However, the price could also decline.
- ANALYSTS’ OPINION: Bank of America forecasts $5,000; Societe Generale forecasts $5,000; Goldman Sachs forecasts $4,900; J.P. Morgan forecasts $5,055; HSBC forecasts $5,000.
TECHNICAL ANALYSIS:
- GOLD TRADING ABOVE MOVING AVERAGES (MA). Gold has kept steady above its 20 -, 50 -, and 100-day moving averages, pointing to an uptrend. However, it could also decline.
- MID-TERM TREND IS UP. The overall trend of gold is up (dark blue trendline), since the beginning of the year, with the trend accelerating since mid – August of 2025.
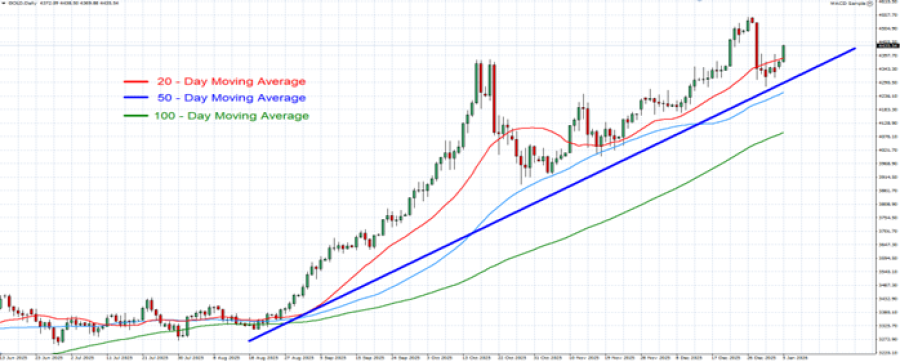
GRAPH (Daily): June 2025 – January 2026
Please note that past performance does not guarantee future results
GOLD, January 05, 2026.
Current Price: 4,423
|
GOLD |
Weekly |
|
Trend direction |
|
|
4,800 |
|
|
4,700 |
|
|
4,550 |
|
|
4,300 |
|
|
4,275 |
|
|
4,250 |
Example of calculation base on weekly trend direction for 1.00 Lot1
|
GOLD |
||||||
|
Pivot Points |
||||||
|
Profit or loss in $ |
37,700 |
27,700 |
12,700 |
-12,300 |
-14,800 |
-17,300 |
|
Profit or loss in €2 |
32,277 |
23,716 |
10,873 |
-10,531 |
-12,671 |
-14,812 |
|
Profit or loss in £2 |
28,074 |
20,627 |
9,457 |
-9,159 |
-11,021 |
-12,883 |
|
Profit or loss in C$2 |
51,969 |
38,184 |
17,507 |
-16,956 |
-20,402 |
-23,848 |
- 1.00 lot is equivalent of 100 units
- Calculations for exchange rate used as of 10:00 (GMT) 05/01/2026
There is a possibility to use Stop-Loss and Take-Profit.
- You may wish to consider closing your position in profit, even if it is lower than suggested one.
- Trailing stop technique could protect the profit.