INTEL(#INTEL) weekly special report based on 1 Lot Calculation:
INTEL: THE COMPANY
- Intel, a pioneer in chip manufacturing and once a leader in the semiconductor industry, is best known for its CPUs (central processing units). Intel also produces graphics cards and flash memory.
- STOCK INDEX PARTICIPATION: Intel stock is a part of the NASDAQ 100 (USA 100) and S&P 500 (USA500).
INTEL – AI PLANS AND EXPANSION
- GAUDI 3 ACCELERATOR ON IBM CLOUD (May 2025): Intel’s latest AI chip, Gaudi 3, is targeting large language model training with up to 2x faster performance than its predecessor and a better price-to-performance ratio than Nvidia’s H100. Intel and IBM have made Gaudi 3 accelerators available in IBM Cloud regions in Frankfurt, Washington, D.C., and Dallas.
- DELL LAUNCHED THE “DELL AI FACTORY” PLATFORM BUILT AROUND INTEL GAUDI 2 ACCELERATORS in the PowerEdge XE9680 server, offering 70% better inference price‑performance on Llama 3 80B models and open-source flexibility (May 2025).
INTEL - EVENTS
- EVENT (THURSDAY, JULY 24, AFTERMARKET): Q2 EARNINGS REPORT. Intel expects to publish $11.8 billion in revenues. The company is expected to release $34.6 million in Net Income.
- REVENUE AND EARNINGS PERFORMANCE: INTEL TENDS TO BEAT ESTIMATES. The company has beaten Earnings Per Share (EPS) estimates 6 times over the past 8 quarters, while its revenue has managed to beat estimates 7 times over the past 8 quarters.
- LAST TIME (Q1 EARNINGS RELEASED ON APRIL 24, 2025, AFTERMARKET): Intel reported a higher-than-expected revenue figure ($12.67 billion vs. $12.30 billion expected) and better-than-expected Earnings Per Share figures ($0.13 vs. $0.01 expected).
INTEL: TECHNICAL ANALYSIS
- UPTREND SUPPORT LINE: Price action has respected a clearly defined ascending trendline (orange), confirming higher lows since early June 2025.
- PRICE IS TRADING ABOVE ALL MAJOR MOVING AVERAGES: The 20-day (red), 50-day (blue), and 100-day (green) moving averages are all positioned below the current price, confirming positive momentum.
- THE STOCK PRICE HIT ITS HIGHEST LEVEL SINCE 2000 ON JANUARY 24, 2020 ($69.19). The stock price currently trades around $22.60, and if a full recovery to its recent highs takes place ($69.19), then it could offer an upside of around 206%. However, the stock price could decline as well.
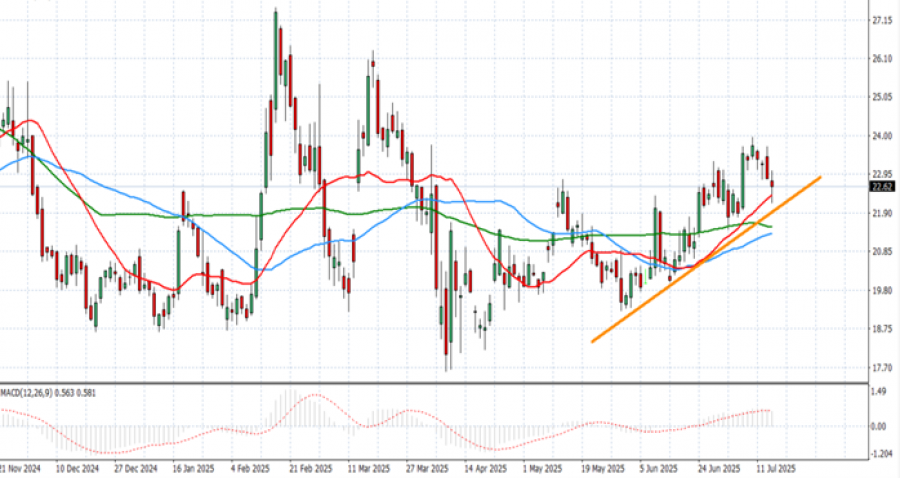
GRAPH (Daily): November 2024– June 2025
Please note that past performance does not guarantee future results
#INTEL, July 17, 2025.
Current Price: 22.60
|
Intel |
Weekly |
|
Trend direction |
|
|
32.00 |
|
|
30.00 |
|
|
27.00 |
|
|
19.00 |
|
|
18.00 |
|
|
17.00 |
Example of calculation based on weekly trend direction for 1.00 Lot1
|
Intel |
||||||
|
Pivot Points |
||||||
|
Profit or loss in $ |
9,400 |
7,400 |
4,400 |
-3,600 |
-4,600 |
-5,600 |
|
Profit or loss in €² |
8,123 |
6,395 |
3,802 |
-3,111 |
-3,975 |
-4,839 |
|
Profit or loss in £² |
7,028 |
5,532 |
3,289 |
-2,691 |
-3,439 |
-4,187 |
|
Profit or loss in C$² |
12,927 |
10,176 |
6,051 |
-4,951 |
-6,326 |
-7,701 |
- 1.00 lot is equivalent of 1000 units
- Calculations for exchange rate used as of 09:15 (GMT+1) 17/07/2025
There is a possibility to use Stop-Loss and Take-Profit
- You may wish to consider closing your position in profit, even if it is lower than the suggested one.
- Trailing stop technique could protect the profit