NATURAL GAS weekly special report based On 1.00 Lot Calculation:
NATURAL GAS GLOBAL MARKETS:
- LARGEST NATURAL GAS SUPPLIER IN THE WORLD (LNG + PIPELINE): 1. RUSSIA (173.81 million tons); 2. USA; 3. QATAR; 4. NORWAY; 5. AUSTRALIA;
- LARGEST NATURAL GAS IMPORTER IN THE WORLD: CHINA (121.99 million tons)
- CHINA’S LARGEST NATURAL GAS SUPPLIER: 1. AUSTRALIA (~26%); 2. TURKMENISTAN (~20%); 3. RUSSIA (~10%).
- E.U. USED TO IMPORT 45% OF NEEDED NATURAL GAS FROM RUSSIA BEFORE THE UKRAINE CONFLICT (OF TOTAL 251.44 million tons): 113 million tons (average daily consumption: 32.85 million tons).
- RUSSIA EXPORTS TO THE E.U. USED TO ACCOUNT FOR 65% OF TOTAL EXPORTS: 113 million tons of 173.81 goes to the E.U.
NATURAL GAS STORAGE REFILLING IN EUROPE FOR 2023/2024 SEASON TO SEE DIFFICULTIES:
- EUROPE WILL NOT RELY ON RUSSIA TO REFILL CAPACITIES FOR THE NEXT SEASON AS RUSSIA STOPPED MOST NATURAL GAS FLOWS TO EUROPE IN 2022. The season of refilling in Europe could be expected to start March- April 2023.
- EUROPE WILL HAVE TO INCREASE PURCHASES OF LIQUEFIED NATURAL GAS (LNG) FROM THE USA. Europe is now expected to increase purchases from the US as Russia has almost fully cut off supply to Europe due to the Ukrainian war. Europe has limited infrastructure to take in LNG and therefore further difficulties could occur.
- US LNG EXPORTS WILL RISE CONSIDERABLY IN 2023 AND BEYOND. Increased LNG exports from the US could have a positive impact on the US Natural gas price as less natural gas will be available for domestic markets. This imbalance could increase fears over natural gas shortages in the US, which in return, could have a positive impact on the US Natural Gas price. US Natural Gas Storage FELL by 58 billion cubic feet last week vs. expected DECLINE of 62 bcf. Still, US stockpiles are now 24% above 5- year average, the highest surplus since July 2016.
NEWS:
- FREEPORT LNG RECEIVED REGULATORY APPROVAL TO RESTART THE THIRD LIQUEFACTION TRAIN. Liquefaction trains are used to accomplish the process of turning gas into LNG. When working at full capacity, Freeport LNG can produce about 2.1 billion cubic feet of gas for export.
- US Natural Gas Storage (March 16) FELL by 58 billion cubic feet last week vs. expected DECLINE of 62 bcf. Still, US stockpiles are now 24% above 5- year average, the highest surplus since July 2016.
PRICE ACTION:
- NATURAL GAS HIT ITS LOWEST PRICE IN 2 YEARS AND 5 MONTHS ($2.110): Natural Gas has undergone a downward correction of around 85% since August 21, 2022 (down from its 2008 high of $9.972). Natural gas traded last around $2.5 and if a full recovery followed, that could imply an upside of around 296.5 %. However, the price could also decline further.
- STATISTICS (2000- 2022): Average natural gas price in March is $4.35 followed by further increase in April, when the price averaged $4.5. This is the period when countries start refilling their natural gas storages after winter which reflects on natural gas prices in a positive way.
Average Monthly Prices 2000-2022
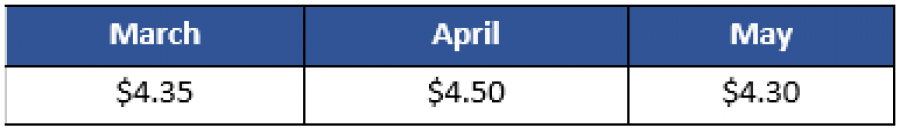
Source: Yahoo Finance
Please note that past performance does not guarantee future results.
Graph: Natural Gas Price (1996-2023)
- TECHNICAL REVIEW: The price has fallen to its traditional bottom of around 2.00. The bottom near 2 has been tested only six times since September 1996. Historically, when Natural Gas falls near the bottom of 2, that happens in the January- February period, while the recovery seems to be happening in March and beyond.
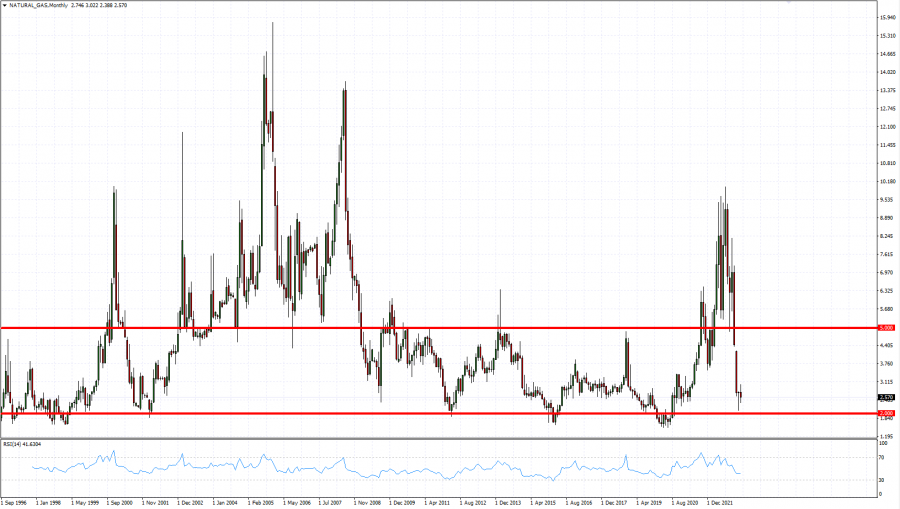
Source: MT4
Please note that past performance does not guarantee future results.
NATURAL GAS, March 17, 2023
Current Price: 2.50
|
NATURAL GAS |
Weekly |
|
Trend direction |
|
|
5.00 |
|
|
4.00 |
|
|
3.00 |
|
|
2.08 |
|
|
1.80 |
|
|
1.70 |
Example of calculation based on weekly trend direction for 1 Lot1
|
Pivot Points |
||||||
|
Profit or loss in $ |
15,000.00 |
15,000.00 |
5,000.00 |
-4,200.00 |
-7,000.00 |
-8,000.00 |
|
Profit or loss in €² |
14,059.23 |
14,059.23 |
4,686.41 |
-3,936.58 |
-6,560.97 |
-7,498.25 |
|
Profit or loss in £² |
12,324.99 |
12,324.99 |
4,108.33 |
-3,451.00 |
-5,751.66 |
-6,573.33 |
|
Profit or loss in C$² |
20,518.80 |
20,518.80 |
6,839.60 |
-5,745.26 |
-9,575.44 |
-10,943.36 |
1. 1 lot is equivalent of 10,000 units
2. Calculations for exchange rate used as of 07:50 (GMT) 17/03/2023
Fortrade recommends the use of Stop-Loss and Take-Profit, please speak to your Senior Account ManagerClient Manager regarding their use.
· You may wish to consider closing your position in profit, even if it is lower than suggested one
· Trailing stop technique can protect the profit – Ask your Senior Account ManagerClient Manager for more details