Natural Gas weekly special report based On 1 Lot Calculation:
NATURAL GAS STORAGE REFILLING SEASON STARTS SOON:
- EUROPE WILL NOT RELY ON RUSSIA TO REFILL CAPACITIES FOR THE NEXT SEASON AS RUSSIA STOPPED MOST NATURAL GAS FLOWS TO EUROPE IN 2022. The season of refilling in Europe could be expected to start March- April 2023.
- EUROPE WILL HAVE TO INCREASE PURCHASES OF LIQUEFIED NATURAL GAS (LNG) FROM THE USA as Russia has almost fully cut off supply to Europe due to the Ukrainian war.
- US LNG EXPORTS WILL RISE CONSIDERABLY IN 2023 AND BEYOND. Increased LNG exports from the US could have a positive impact on the US Natural gas price as less natural gas will be available for domestic markets. This imbalance could increase fears over natural gas shortages in the US, which in return, could have a positive impact on the US Natural Gas price.
US LIGUIFIED NATURAL GAS (LNG) EXPORTS:
- APRIL: US LIQUIFIED NATURAL GAS (LNG) EXPORTS REACHED RECORD HIGHS. Average gas flows to all seven big U.S. LNG export plants have risen to 14.9 billion cubic feet per day (bcfd) so far in April, up from a record 13.2 bcfd in March, signaling the export gains may continue in the weeks to come.
PRICE ACTION:
- NATURAL GAS HIT ITS LOWEST PRICE IN 2 YEARS AND 7 MONTHS ($1.943): Natural Gas has undergone a downward correction of around 80.50% since August 21,2022 (down from 2008 high of $9.972). Natural gas traded last around $2.35 and if a full recovery followed, that could imply an upside of around 320%. However, the price could also decline further.
- GOLDMAN SACHS SEES EUROPEAN NATURAL GAS PRICES UP 153% FROM CURRENT PRICES IN THE PERIOD JULY- OCTOBER 2023 (AT 153 EURO FROM CURRENT 43 EURO PER MEGAWATT HOUR). According to their note, the European Natural Gas prices could rally a little over 20% in the near future (next few weeks).
- PRICE STATISTICS (2001- 2022): Average natural gas price in May since 2001, was $4.64. In June the average price was $4.51 and in July $4.27. This is the period when countries start refilling their natural gas storages after winter which reflects on natural gas prices.
Average Monthly Prices 2001-2022
Source: Yahoo Finance
Please note that past performance does not guarantee future results.
TECHNICAL REVIEW
- The price has fallen to its traditional bottom of around 2.00. The bottom near 2 has been tested only six times since September 1996. Historically, when Natural Gas falls near the bottom of 2, that happens in the January- February period, while the recovery seems to be happening in March and beyond. AVERAGE: On average, Natural Gas trades this low every 4-5 years.
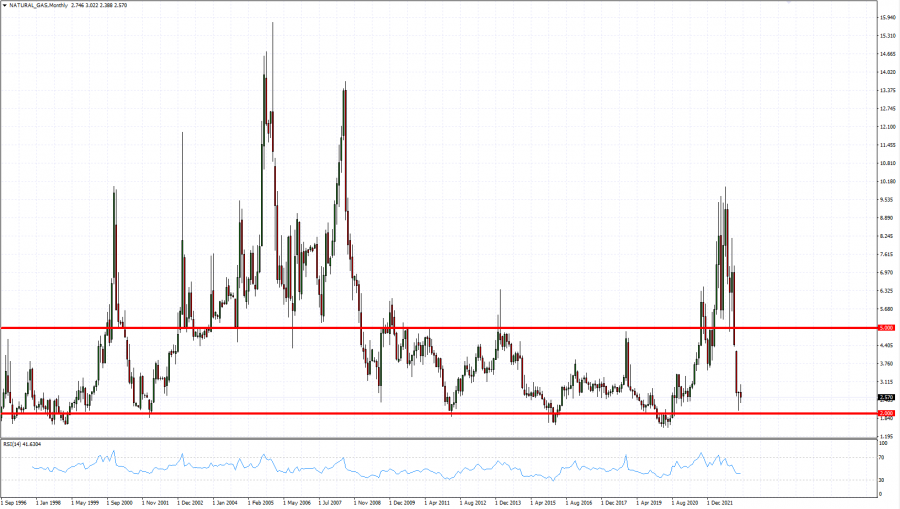
Graph: Natural Gas Price (1996-2023)
Source: MT4
Please note that past performance does not guarantee future results.
NATURAL GAS, April 20, 2023
Current Price: 2.35
|
NATURAL GAS |
Weekly |
|
Trend direction |
|
|
4.00 |
|
|
3.50 |
|
|
3.00 |
|
|
1.90 |
|
|
1.75 |
|
|
1.65 |
Example of calculation based on weekly trend direction for 1 Lot1
|
Pivot Points |
||||||
|
Profit or loss in $ |
16,500.00 |
11,500.00 |
6,500.00 |
-4,500.00 |
-6,000.00 |
-7,000.00 |
|
Profit or loss in €² |
15,038.96 |
10,481.70 |
5,924.44 |
-4,101.54 |
-5,468.71 |
-6,380.17 |
|
Profit or loss in £² |
13,260.04 |
9,241.85 |
5,223.65 |
-3,616.37 |
-4,821.83 |
-5,625.47 |
|
Profit or loss in C$² |
22,221.29 |
15,487.57 |
8,753.84 |
-6,060.35 |
-8,080.47 |
-9,427.22 |
1. 1 lot is equivalent of 10,000 units
2. Calculations for exchange rate used as of 09:45 (GMT+1) 20/04/2023
Fortrade recommends the use of Stop-Loss and Take-Profit, please speak to your Senior Account ManagerClient Manager regarding their use.
· You may wish to consider closing your position in profit, even if it is lower than suggested one
· Trailing stop technique can protect the profit – Ask your Senior Account ManagerClient Managerfor more details