Natural Gas weekly special report based on 1.00 Lot Calculation:
TECHNICAL ANALYSIS:
- BREAKING (AUGUST 13): NATURAL GAS PRICES TESTED THEIR LOWEST LEVELS SINCE NOVEMBER 2024 ($2.759)
- STRONG SUPPORT AT: $3. Natural Gas prices have tested the mark of $3 or near 6 times since November 2024. This is its 7th time to test the area around $3.
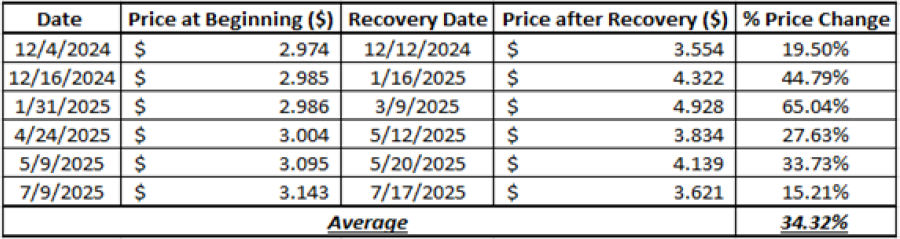
- STATISTICS (NOVEMBER 2024 - AUGUST 2025): NATURAL GAS ROSE ON AVERAGE AROUND 34.32% AFTER TESTING FIRST LEVELS NEAR THE MARK OF $3. According to the table below, Natural Gas prices would see an average price recovery of around 34% after first testing the area near the mark of $3.
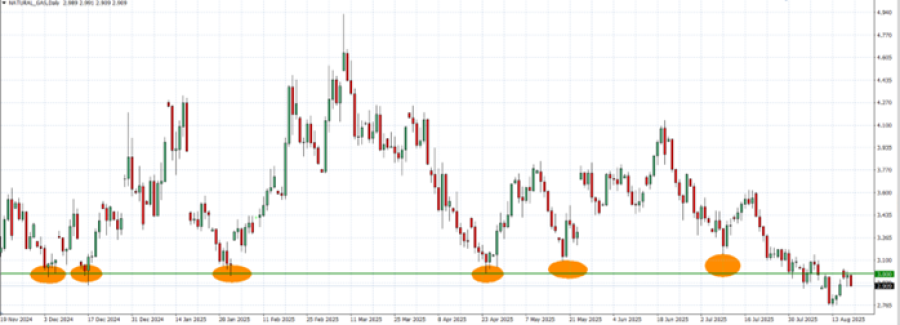
GRAPH (Daily): November 2024– August 2025
- 2024-2025 STATISTICS: NATURAL GAS TENDS TO RECOVER BY AROUND 34.32% ON AVERAGE AFTER TESTING THE MARK OF $3 OR NEAR IT.
Data Source: Meta Trader 4 Platform
Please note that past performance does not guarantee future results
EVENTS:
- THURSDAY, AUGUST 21 AT 15:30 GMT+1: ENERGY INFORMATION ADMINISTRATION (EIA) NATURAL GAS INVENTORY DATA (USA). If data showed a declining inventory for the past week, then positive support for the natural gas price could be expected. However, the price could decline.
Natural Gas, August 19, 2025.
Current Price: 2.90
|
NATURAL GAS |
Weekly |
|
Trend direction |
|
|
4.50 |
|
|
4.00 |
|
|
3.40 |
|
|
2.60 |
|
|
2.50 |
|
|
2.40 |
Example of calculation based on weekly trend direction for 1.00 Lot1
|
NATURAL GAS |
||||||
|
Pivot Points |
||||||
|
Profit or loss in $ |
16,000 |
11,000 |
5,000 |
-3,000 |
-4,000 |
-5,000 |
|
Profit or loss in €² |
13,706 |
9,423 |
4,283 |
-2,570 |
-3,426 |
-4,283 |
|
Profit or loss in £² |
11,846 |
8,144 |
3,702 |
-2,221 |
-2,962 |
-3,702 |
|
Profit or loss in C$² |
22,135 |
15,218 |
6,917 |
-4,150 |
-5,534 |
-6,917 |
- 1.00 lot is equivalent of 10,000 units
- Calculations for exchange rate used as of 13:35 (GMT+1) 19/08/2025
There is a possibility to use Stop-Loss and Take-Profit.
- You may wish to consider closing your position in profit, even if it is lower than the suggested one.
- Trailing stop techniques could protect the profit.