Natural Gas weekly special report based on 1.00 Lot Calculation:
NATURAL GAS USE AND MARKET SHARE:
- NATURAL GAS is mainly used for electricity generation and heating. In the U.S., about 45% of homes use natural gas for heating.
- MARKET SHARE - PRODUCERS: BIGGEST NATURAL GAS PRODUCERS IN THE WORLD. The U.S. is the largest producer, with ~25% of the global market share, while Russia is the second with ~15% of the market. Iran is third with ~5%.
- MARKET SHARE - LNG (LIQUEFIED NATURAL GAS) EXPORTERS: The U.S. is the major LNG exporter, holding ~ 21% of the global market share, while Australia is the second with ~ 20% of the market. Qatar is third with ~19% and Russia fourth with ~ 8% of the global market.
- MARKET SHARE - CONSUMERS: The U.S. is the world's largest natural gas consumer, with ~ 22% of global consumption, while Russia holds ~ 11.6%, the EU ~11% and China ~ 10.6%.
- MARKET SHARE - LNG- LIQUEFIED NATURAL GAS IMPORTERS: China is the world's largest LNG importer, with ~19-23.5% of global imports, Japan is second with ~ 16%- 18% and the EU ~14%-15%. (Source: IEA)
GEOPOLITICS: RUSSIA – UKRAINE CONFLICT
- BREAKING (DECEMBER 16): US OFFERS SECURITY GUARANTEES TO UKRAINE, BUT TERRITORY ISSUES REMAIN IN PLACE. The US has offered Ukraine security guarantees similar to Article 5 of NATO, however the offer is on the table for a limited time. Furthermore, both the Russians and the Ukrainians are still not willing to give up on territory claims.
LAST TIME (OCTOBER): TRUMP - PUTIN CALL ON OCTOBER 16, 2025. The call led to a potential new summit between US President Trump and Russia’s Putin, but due to further disagreements, the summit never happened, and Trump announced sanctions on Russia’s Lukoil and Rosneft on October 22.
PRICE ACTION (OCTOBER 17 - OCTOBER 22): NATURAL GAS PRICE ROSE FROM $2.920 TO $3.565 (an increase of 22.08%). Before the collapse of the Putin–Trump summit and Trump’s sanctions on Russia’s Lukoil and Rosneft, the natural gas price had been declining to test $2.92 on some potential optimism. However, the summit efforts collapsed and, moreover, Trump announced oil sanctions on Russia (October 22), which caused natural gas prices to rise to $3.565 until October 22.
Data Source: MetaTrader 4 Platform
Please note that past performance does not guarantee future results
EU NATURAL GAS CAPACITY
- EU NATURAL GAS CAPACITY BELOW AVERAGES. The EU natural gas capacity is at 70.5% full, which is down 11.2% from its 5-year average, indicating strong demand in the EU.
US LNG EXPORTS
- U.S LNG EXPORTS CONTINUE BREAKING RECORDS. US liquified natural gas exports have hit a new monthly all-time high record in November for the second straight month, driven by cooler weather in the US and robust output from the US two largest producers. The US shipped 10.9 million metric tons, up from 10.1 in October, despite November having one day less compared to October.
EVENTS:
- THURSDAY, DECEMBER 18 AT 15:30 GMT: U.S. WEEKLY NATURAL GAS STORAGE DATA. According to data from the past four weeks, U.S. natural gas storage has begun to decline amid colder temperatures and higher demand and consumption. If this trend continues, it could provide positive support for natural gas prices.
TECHNICAL ANALYSIS
- SUPPORT ZONE $3.50 – $3.00. Since the beginning of the year 2025, a support zone between $3.50 and $3.00 has formed with the price of natural gas recovering every time it has entered this zone.
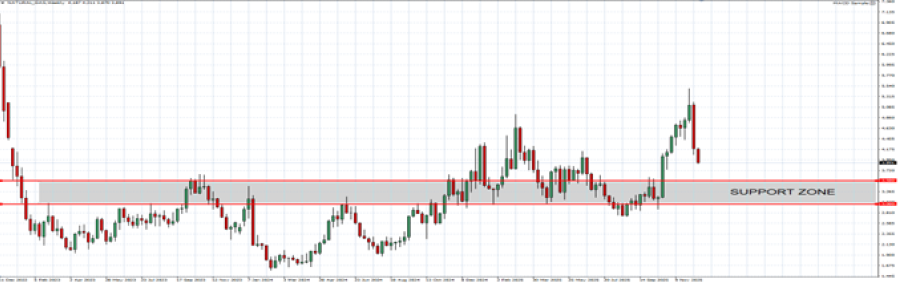
GRAPH (Weekly): December 2022 – December 2025
Please note that past performance does not guarantee future results
Natural Gas, December 16, 2025
Current Price: 3.935
|
NATURAL GAS |
Weekly |
|
Trend direction |
|
|
5.100 |
|
|
4.800 |
|
|
4.500 |
|
|
3.500 |
|
|
3.250 |
|
|
3.000 |
Example of calculation based on weekly trend direction for 1.00 Lot1
|
NATURAL GAS |
||||||
|
Pivot Points |
||||||
|
Profit or loss in $ |
11,650 |
8,650 |
5,650 |
-4,350 |
-6,850 |
-9,350 |
|
Profit or loss in €² |
9,891 |
7,344 |
4,797 |
-3,693 |
-5,816 |
-7,938 |
|
Profit or loss in £² |
8,670 |
6,437 |
4,205 |
-3,237 |
-5,098 |
-6,958 |
|
Profit or loss in C$² |
16,015 |
11,891 |
7,767 |
-5,980 |
-9,417 |
-12,853 |
- 1.00 lot is equivalent of 10,000 units
- Calculations for exchange rate used as of 13:10 (GMT) 16/12/2025
There is a possibility to use Stop-Loss and Take-Profit.
- You may wish to consider closing your position in profit, even if it is lower than the suggested one.
- Trailing stop techniques could protect the profit.