Natural Gas weekly special report based on 1.00 Lot Calculation:
NATURAL GAS USE AND MARKET SHARE:
- NATURAL GAS is mainly used for electricity generation and heating. In the U.S., about 45% of homes use natural gas for heating.
- MARKET SHARE - PRODUCERS: BIGGEST NATURAL GAS PRODUCERS IN THE WORLD. The U.S. is the largest producer, with ~25% of the global market share, while Russia is the second with ~15% of the market. Iran is third with ~5%.
- MARKET SHARE - LNG (LIQUEFIED NATURAL GAS) EXPORTERS: The U.S. is the major LNG exporter, holding ~21% of the global market share, while Australia is the second with ~ 20% of the market. Qatar is third with ~19% and Russia fourth with ~ 8% of the global market.
- MARKET SHARE - CONSUMERS: The U.S. is the world's largest natural gas consumer, with ~ 22% of global consumption, while Russia holds ~ 11.6%, the EU ~11%, and China ~ 10.6%.
- MARKET SHARE - LNG- LIQUEFIED NATURAL GAS IMPORTERS: China is the world's largest LNG importer, with ~19-23.5% of global imports, Japan is second with ~ 16%- 18%, and the EU ~14%-15%. (Source: IEA)
GEOPOLITICS: MIDDLE EAST
- MIDDLE EAST TENSIONS REMAIN HIGH: US MILITARY EQUIPMENT CONTINUES TO BUILD UP IN THE MIDDLE EAST, NEAR IRAN. The US “USS ABRAHAM LINCOLN” carrier and its group are expected to arrive in the Middle East, near Iran, by the end of the current week. Other equipment and military assets remain on their way to the Middle East as well.
- BREAKING (JANUARY 21): 25TH DAY OF IRANIAN PROTESTS AND STREET CLASHES WITH IRAN’S FORCES.
STRAIT OF HORMUZ AT RISK: KEY LIQUEFIED NATURAL GAS (LNG) SUPPLY ROUTE. The Strait of Hormuz is a critical energy chokepoint through which 20–25% of global LNG exports pass, mainly from Qatar, one of the world’s largest LNG exporters. Rising tensions with Iran raise the risk that Tehran could attempt to block or disrupt traffic through the strait, which would significantly tighten global LNG supply and add upside pressure to natural gas prices.
EVENTS:
- THURSDAY, JANUARY 22 AT 15:30 GMT: U.S. WEEKLY NATURAL GAS STORAGE DATA. U.S. natural gas inventories have declined for the past eight consecutive weeks, confirming tightening market fundamentals. Another larger than expected decline would reinforce the tightening trend and could provide further upside support for natural gas prices.
US WEATHER FORECAST (LATE JANUARY / EARLY FEBRUARY)
- WEATHER FORECASTS (Source: BBC News): ARCTIC BLAST SET TO HIT THE U.S. An Arctic blast from Canada is expected to bring very cold conditions from the Midwest to the Northeast, affecting more than 50 million people. The sharp drop in temperatures could boost heating demand, supporting higher U.S. natural gas consumption, as over 40% of U.S. households rely on natural gas for heating.
TECHNICAL ANALYSIS
- RECENT BREAK HIGH ABOVE ONE-MONTH RANGE (JANUARY 21): Natural gas prices have climbed to highs of $4.94, rising by more than 25% in a day, marking their highest level in more than one month. The move indicated improving short-term momentum. Although the price could fall, too.
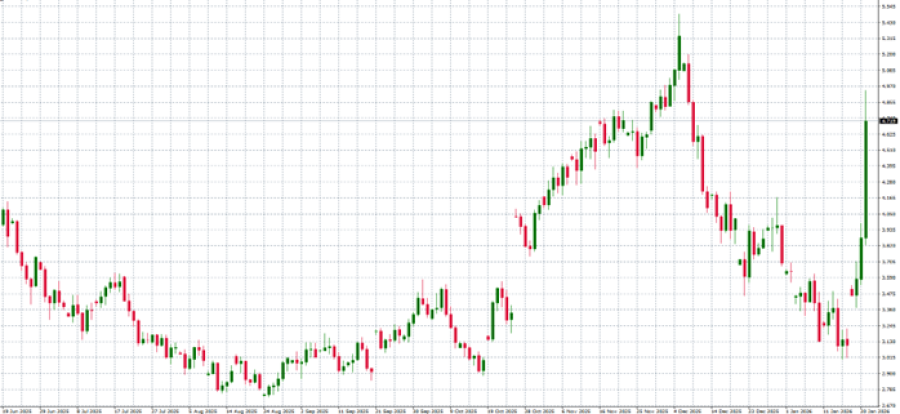
GRAPH (Daily): June 2025 – January 2026
Please note that past performance does not guarantee future results
Natural Gas, January 21, 2026
Current Price: 4.600
|
NATURAL GAS |
Weekly |
|
Trend direction |
|
|
7.000 |
|
|
6.000 |
|
|
5.300 |
|
|
4.000 |
|
|
3.800 |
|
|
3.600 |
Example of calculation based on weekly trend direction for 1.00 Lot1
|
NATURAL GAS |
||||||
|
Pivot Points |
||||||
|
Profit or loss in $ |
24,000 |
14,000 |
7,000 |
-6,000 |
-8,000 |
-10,000 |
|
Profit or loss in €² |
20,500 |
11,958 |
5,979 |
-5,125 |
-6,833 |
-8,542 |
|
Profit or loss in £² |
17,892 |
10,437 |
5,219 |
-4,473 |
-5,964 |
-7,455 |
|
Profit or loss in C$² |
33,211 |
19,373 |
9,686 |
-8,303 |
-11,070 |
-13,838 |
- 1.00 lot is equivalent of 10,000 units
- Calculations for exchange rate used as of 10:20 (GMT) 21/01/2026
There is a possibility to use Stop-Loss and Take-Profit.
- You may wish to consider closing your position in profit, even if it is lower than the suggested one.
- Trailing stop techniques could protect the profit.