Natural Gas weekly special report based on 1.00 Lot Calculation:
NATURAL GAS USE AND MARKET SHARE:
- NATURAL GAS is mainly used for electricity generation and heating. In the U.S., about 45% of homes use natural gas for heating.
- MARKET SHARE - PRODUCERS: BIGGEST NATURAL GAS PRODUCERS IN THE WORLD. The U.S. is the largest producer, with ~25% of the global market share, while Russia is the second with ~15% of the market. Iran is third with ~5%.
- MARKET SHARE - LNG (LIQUEFIED NATURAL GAS) EXPORTERS: The U.S. is the major LNG exporter, holding ~21% of the global market share, while Australia is the second with ~ 20% of the market. Qatar is third with ~20% and Russia fourth with ~ 8% of the global market.
- MARKET SHARE - CONSUMERS: The U.S. is the world's largest natural gas consumer, with ~ 22% of global consumption, while Russia holds ~ 11.6%, the EU ~11%, and China ~ 10.6%.
- MARKET SHARE - LNG- LIQUEFIED NATURAL GAS IMPORTERS: China is the world's largest LNG importer, with ~19-23.5% of global imports, Japan is second with ~ 16%- 18%, and the EU ~14%-15%. (Source: IEA)
US WEATHER CONDITIONS WORSENED IN LATE JANUARY 2026
- U.S. WEATHER: AN ARCTIC BLAST HIT THE U.S. DURING THE WEEKEND (JANUARY 24-JANUARY 25). Over the past weekend, a winter storm bringing heavy snow and ice affected large parts of the United States. More than 800,000 households lost power, according to PowerOutage.us. According to Reuters, while the storm system was expected to drift away from the East Coast into the Atlantic on Monday (January 26), more Arctic air was forecast to rush in behind it, prolonging bitter cold and icy conditions over the next few days, the weather service said.
- US NATURAL GAS PRODUCTION DROPS BY AROUND 10%. U.S. natural gas production has plunged by about 10 billion cubic feet in recent days as frigid weather has frozen pipelines, choking off supply, even as demand for the heating fuel has surged by about 18 billion cubic feet, according to BNEF data.
GEOPOLITICS: MIDDLE EAST
- MIDDLE EAST TENSIONS REMAIN HIGH: US MILITARY EQUIPMENT CONTINUES TO BUILD UP IN THE MIDDLE EAST, NEAR IRAN. The US “USS ABRAHAM LINCOLN” carrier and its group arrived in the Middle East, near Iran, late last week. Other equipment and military assets remain on their way to the Middle East as well.
STRAIT OF HORMUZ AT RISK: KEY LIQUEFIED NATURAL GAS (LNG) SUPPLY ROUTE. The Strait of Hormuz is a critical energy chokepoint through which 20–25% of global LNG exports pass, mainly from Qatar, one of the world’s largest LNG exporters. Rising tensions with Iran raise the risk that Tehran could attempt to block or disrupt traffic through the strait, which would significantly tighten global LNG supply and add upside pressure to natural gas prices.
TECHNICAL ANALYSIS
- SUPPORT: $3. Natural gas has maintained strong support at $3 since late 2024. It has tested the $3 level seven times since late 2024, confirming the zone as strong support.
- BREAKING (JANUARY 23): NATURAL GAS PRICE HIT ITS HIGHEST LEVELS IN MORE THAN THREE YEARS ($5.640): Natural gas prices have climbed to highs of $5.640, rising by more than 80% only last week, marking their highest level in more than three years. The move indicated improving short-term momentum. Although the price could fall, too.
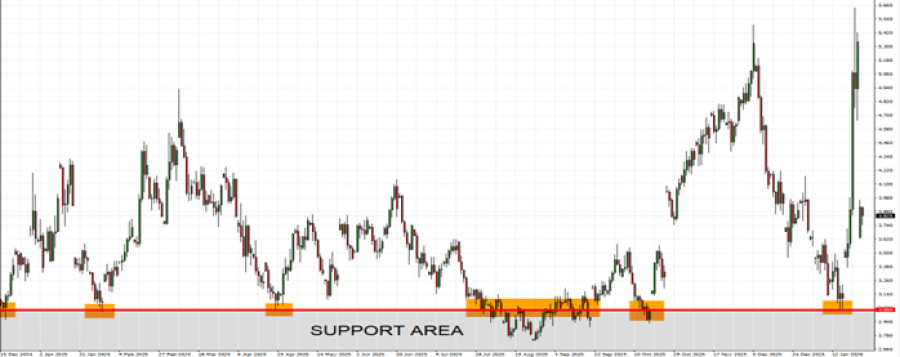
GRAPH (Daily): December 2024 – January 2026
Please note that past performance does not guarantee future results
Natural Gas, January 26, 2026
Current Price: 3.770
|
NATURAL GAS |
Weekly |
|
Trend direction |
|
|
5.350 |
|
|
4.800 |
|
|
4.400 |
|
|
3.200 |
|
|
3.100 |
|
|
3.000 |
Example of calculation based on weekly trend direction for 1.00 Lot1
|
NATURAL GAS |
||||||
|
Pivot Points |
||||||
|
Profit or loss in $ |
15,800 |
10,300 |
6,300 |
-5,700 |
-6,700 |
-7,700 |
|
Profit or loss in €² |
13,337 |
8,694 |
5,318 |
-4,811 |
-5,656 |
-6,500 |
|
Profit or loss in £² |
11,563 |
7,538 |
4,611 |
-4,172 |
-4,903 |
-5,635 |
|
Profit or loss in C$² |
21,617 |
14,092 |
8,619 |
-7,798 |
-9,167 |
-10,535 |
- 1.00 lot is equivalent of 10,000 units
- Calculations for exchange rate used as of 09:10 (GMT) 26/01/2026
There is a possibility to use Stop-Loss and Take-Profit.
- You may wish to consider closing your position in profit, even if it is lower than the suggested one.
- Trailing stop techniques could protect the profit.