Natural Gas weekly special report based on 1.00 Lot Calculation:
NATURAL GAS USE AND MARKET SHARE:
- NATURAL GAS is mainly used for electricity generation and heating. In the U.S., about 45% of homes use natural gas for heating.
- MARKET SHARE - PRODUCERS: BIGGEST NATURAL GAS PRODUCERS IN THE WORLD. The U.S. is the largest producer, with ~25% of the global market share, while Russia is the second with ~15% of the market. Iran is third with ~5%.
- MARKET SHARE - LNG (LIQUEFIED NATURAL GAS) EXPORTERS: The U.S. is the major LNG exporter, holding ~21% of the global market share, while Australia is the second with ~ 20% of the market. Qatar is third with ~20% and Russia fourth with ~ 8% of the global market.
- MARKET SHARE - CONSUMERS: The U.S. is the world's largest natural gas consumer, with ~ 22% of global consumption, while Russia holds ~ 11.6%, the EU ~11%, and China ~ 10.6%.
- MARKET SHARE - LNG- LIQUEFIED NATURAL GAS IMPORTERS: China is the world's largest LNG importer, with ~19-23.5% of global imports, Japan is second with ~ 16%- 18%, and the EU ~14%-15%. (Source: IEA)
GEOPOLITICS: MIDDLE EAST
- MIDDLE EAST TENSIONS REMAIN HIGH: US MILITARY EQUIMPENT CONTINUED BUILDING UP IN THE MIDDLE EAST, NEAR IRAN. The US “USS ABRAHAM LINCOLN” carrier and its group have arrived in the Middle East, near Iran, in late January. Other equipment and military assets remain on their way to the Middle East as well.
STRAIT OF HORMUZ AT RISK: KEY LIQUIFIED NATURAL GAS (LNG) SUPPLY ROUTE. The Strait of Hormuz is a critical energy chokepoint through which 20–25% of global LNG exports pass, mainly from Qatar, one of the world’s largest LNG exporters. Rising tensions with Iran raise the risk that Tehran could attempt to block or disrupt traffic through the strait, which would significantly tighten global LNG supply and add upside pressure to natural gas prices.
EUROPE: NATURAL GAS STORAGE HAS DECLINED TO 41.6% OF CAPACITY
- EUROPEAN NATURAL GAS STORAGE IS 26.8% BELOW THE 5-YEAR AVERAGE. Natural gas storage levels in Europe have continued to decline, falling below the five-year average and approaching levels last seen in 2022 for the same period of the year. Weather conditions across Europe have supported higher natural gas demand, while a stronger refilling season could be ahead in 2026. After cutting itself off from Russian natural gas, Europe has recently reached an agreement with the United States to increase purchases of liquefied natural gas (LNG).
EVENTS
- THURSDAY, FEBRUARY 5 AT 15:30 GMT: U.S. WEEKLY NATURAL GAS STORAGE DATA. U.S. natural gas inventories have declined for the past ten consecutive weeks, confirming tightening market fundamentals. Another larger than expected decline would reinforce the tightening trend and could provide further upside support for natural gas prices.
TECHNICAL ANALYSIS
- SUPPORT: $3. Natural gas has maintained strong support at $3 since late 2024. It has tested the $3 level seven times since late 2024, confirming the zone as strong support.
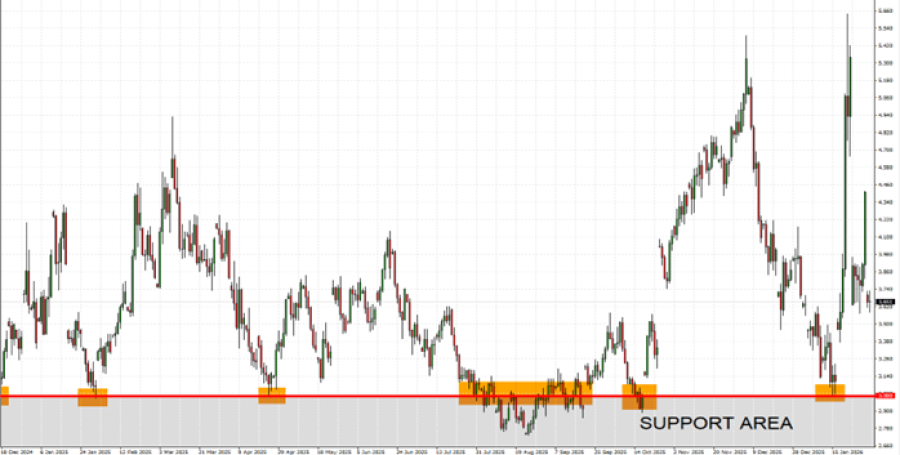
GRAPH (Daily): December 2024 – February 2026
Please note that past performance does not guarantee future results
Natural Gas, February 2, 2026
Current Price: 3.600
|
NATURAL GAS |
Weekly |
|
Trend direction |
|
|
5.000 |
|
|
4.500 |
|
|
4.100 |
|
|
3.200 |
|
|
3.100 |
|
|
3.000 |
Example of calculation based on weekly trend direction for 1.00 Lot1
|
NATURAL GAS |
||||||
|
Pivot Points |
||||||
|
Profit or loss in $ |
14,000 |
9,000 |
5,000 |
-4,000 |
-5,000 |
-6,000 |
|
Profit or loss in €² |
11,798 |
7,585 |
4,214 |
-3,371 |
-4,214 |
-5,056 |
|
Profit or loss in £² |
10,211 |
6,564 |
3,647 |
-2,917 |
-3,647 |
-4,376 |
|
Profit or loss in C$² |
19,081 |
12,266 |
6,814 |
-5,452 |
-6,815 |
-8,177 |
- 1.00 lot is equivalent of 10,000 units
- Calculations for exchange rate used as of 09:10 (GMT) 02/02/2026
There is a possibility to use Stop-Loss and Take-Profit.
- You may wish to consider closing your position in profit, even if it is lower than the suggested one.
- Trailing stop techniques could protect the profit.