Natural Gas weekly special report based on 1.00 Lot Calculation:
NATURAL GAS USE AND MARKET SHARE:
- NATURAL GAS is mainly used for electricity generation and heating. In the U.S., about 45% of homes use natural gas for heating.
- MARKET SHARE - PRODUCERS: BIGGEST NATURAL GAS PRODUCERS IN THE WORLD. The U.S. is the largest producer, with ~25% of the global market share, while Russia is the second with ~15% of the market. Iran is third with ~5%.
- MARKET SHARE - LNG (LIQUEFIED NATURAL GAS) EXPORTERS: The U.S. is the major LNG exporter, holding ~21% of the global market share, while Australia is the second with ~ 20% of the market. Qatar is third with ~20% and Russia fourth with ~ 8% of the global market.
- MARKET SHARE - LNG- LIQUEFIED NATURAL GAS IMPORTERS: China is the world's largest LNG importer, with ~19-23.5% of global imports, Japan is second with ~ 16%- 18%, and the EU ~14%-15%. (Source: IEA)
GEOPOLITICS: MIDDLE EAST
- EVENT (THURSDAY, FEBRUARY 26): MIDDLE EAST TENSIONS REMAIN HIGH: THIRD ROUND OF U.S.–IRAN TALKS. According to Reuters, the next round of indirect nuclear negotiations between the U.S. and Iran will take place again in Geneva, mediated by Oman. Core disagreements remain unresolved, particularly over uranium enrichment and broader security issues.
- BREAKING (FEBRUARY 13): U.S. MILITARY BUILD-UP INTENSIFIES IN INTERNATIONAL WATERS NEAR IRAN. The USS Gerald R. Ford aircraft carrier strike group has been redirected from the Caribbean and is expected to join the USS Abraham Lincoln in the Middle East likely by the end of February. This significantly increases U.S. military presence in the region and reinforces pressure on Iran amid ongoing diplomatic tensions.
STRAIT OF HORMUZ AT RISK: KEY LIQUEFIED NATURAL GAS (LNG) SUPPLY ROUTE. The Strait of Hormuz is a critical energy chokepoint through which 20–25% of global LNG exports pass, mainly from Qatar, one of the world’s largest LNG exporters. Rising tensions with Iran raise the risk that Tehran could attempt to block or disrupt traffic through the strait, tightening global LNG supply and adding upside pressure to natural gas prices.
EUROPE: NATURAL GAS STORAGE HAS DECLINED TO 30.60% OF CAPACITY
- EUROPEAN NATURAL GAS STORAGE IS 34.4% BELOW THE 5-YEAR AVERAGE. Natural gas storage levels in Europe have continued to decline, falling below the five-year average and approaching levels last seen in April 2022. A stronger refilling season could be ahead in 2026. After cutting itself off from Russian natural gas, Europe has recently reached an agreement with the United States to increase purchases of liquefied natural gas (LNG).
EVENTS
- THURSDAY, FEBRUARY 26 AT 15:30 GMT: U.S. WEEKLY NATURAL GAS STORAGE DATA. U.S. natural gas inventories have declined for the past 13 consecutive weeks, confirming tightening market fundamentals.
TECHNICAL ANALYSIS
- BREAKING (FEBRUARY 26): NATURAL GAS PRICE HAS HIT ITS LOWEST RATE SINCE AUGUST 2025 ($2.789).
- SUPPORT AREA: $3. Natural gas has maintained strong support near $3 since late 2024, testing the area eight times and confirming it as a solid support zone. This is the nineth time to trade near the mark of $3. However, it could also decline.
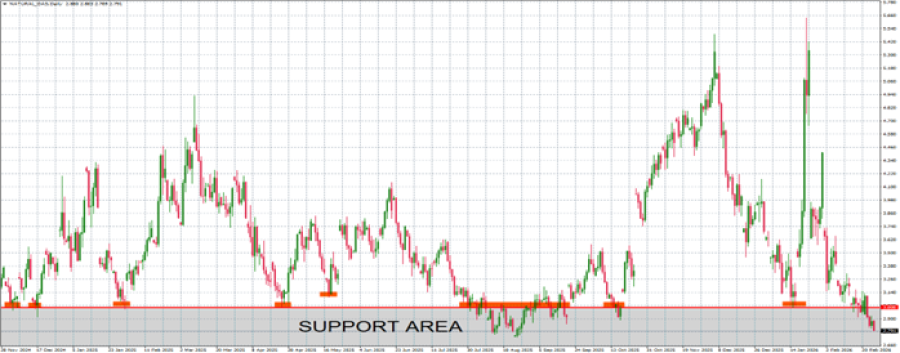
GRAPH (Daily): November 2024 – February 2026
Please note that past performance does not guarantee future results
Natural Gas, February 26, 2026
Current Price: 2.790
|
NATURAL GAS |
Weekly |
|
Trend direction |
|
|
4.000 |
|
|
3.500 |
|
|
3.100 |
|
|
2.500 |
|
|
2.450 |
|
|
2.400 |
Example of calculation based on weekly trend direction for 1.00 Lot1
|
NATURAL GAS |
||||||
|
Pivot Points |
||||||
|
Profit or loss in $ |
12,100 |
7,100 |
3,100 |
-2,900 |
-3,400 |
-3,900 |
|
Profit or loss in €² |
10,259 |
6,020 |
2,628 |
-2,459 |
-2,883 |
-3,307 |
|
Profit or loss in £² |
8,945 |
5,249 |
2,292 |
-2,144 |
-2,514 |
-2,883 |
|
Profit or loss in C$² |
16,547 |
9,709 |
4,239 |
-3,966 |
-4,650 |
-5,333 |
- 1.00 lot is equivalent of 10,000 units
- Calculations for exchange rate used as of 10:00 (GMT) 26/02/2026
There is a possibility to use Stop-Loss and Take-Profit.
- You may wish to consider closing your position in profit, even if it is lower than the suggested one.
- Trailing stop techniques could protect the profit.