SILVER weekly special report based on 1.00 Lot Calculation:
TECHNICAL ANALYSIS:
- 14-DAY RELATIVE STRENGTH INDEX (RSI) INDICATES PLATINUM PRICE IS NEARLY OVERSOLD: According to the daily chart below, the 14-Day RSI is trading just above the oversold threshold of 30, suggesting the silver price itself is getting oversold. Therefore, a price recovery could be next expected, although prices could go into the other direction as well.
- SUPPORT AT $36 - $35 AREA: Silver prices have recently tested the area between $36 and $35, a near term support area. This technical indicator indicates that the current downside potential remains limited, although if prices break below that area, then a negative trend could be observed.
- SILVER PRICE HAS TESTED ITS LOWEST PRICE IN ALMOST 4 WEEKS ($36.188): After the most recent pullback of silver prices, losing around 8% from its recent top ($39.505) over the past 8 days, silver prices have tested their lowest levels in almost 4 weeks ($36.188).
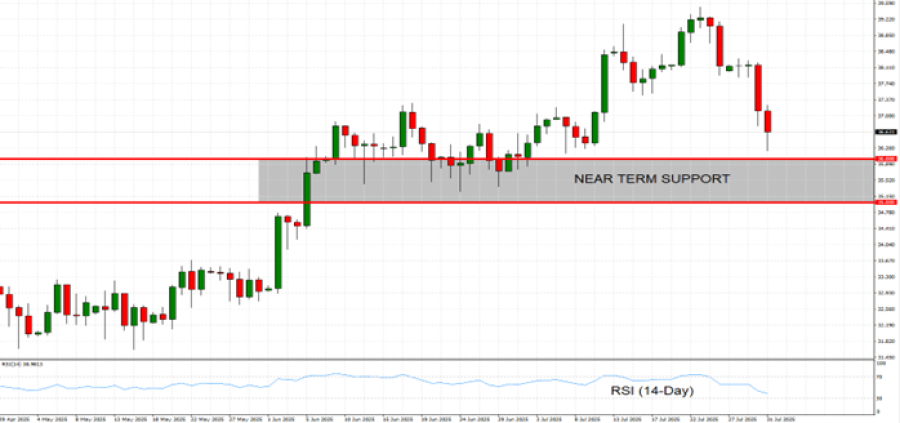
GRAPH (Daily): April 2025 – July 2025
Please note that past performance does not guarantee future results
GEOPOLITICS: RUSSIA – UKRAINE/USA CONFLICT
- EVENT (EXPECTED BY AUGUST 10): US PRESIDENT TRUMP REDUCED THE DEADLINE PERIOD FOR RUSSIA TO REACH A CEASEFIRE DEAL WITH UKRAINE (10 DAYS) AFTER WHICH THE USA WILL SLAP NEW SANCTIONS AND SECONDARY TARIFFS. According to Reuters, U.S. President Donald Trump set a new deadline of 10 days (down from the previous 50-day deadline set on July 14) for Russia to make progress toward ending the war in Ukraine or face consequences. Trump has threatened sanctions on both Russia and buyers of its exports unless progress is made. Trump reiterated that, without a deal, his administration would impose 100% secondary tariffs on countries continuing to import Russian exports.
EVENTS:
- FRIDAY, AUGUST 1 AT 13:30 GMT+1: US NONFARM PAYROLLS (NFP) AND UNEMPLOYMENT RATE (JULY). US labor data remains in focus as the Fed weighs its next move. June NFP beat forecasts (147,000 vs. 111,000) and unemployment fell to 4.1% (vs. 4.3% expected). Weak July data could boost rate cut expectations, pressuring the US dollar.
- FRIDAY, AUGUST 1 AT 15:00 GMT+1: US ISM MANUFACTURING PMI (JULY). The US manufacturing activity remains negatively pressured as recent figures have come in below the expansion territory of 50. In June, the data came in at 49, suggesting that the US manufacturing industry remains in the zone of economic contraction. If the trend remains in place, the Fed could then get more encouraged to act and decide to cut interest rates again soon, which in turn, could put negative pressure on the US dollar, while silver prices could see some positive support.
SILVER, July 31, 2025.
Current Price: 36.40
|
SILVER |
Weekly |
|
Trend direction |
|
|
39.50 |
|
|
38.50 |
|
|
37.50 |
|
|
35.50 |
|
|
35.00 |
|
|
34.50 |
Example of calculation base on weekly trend direction for 1.00 Lot1
|
SILVER |
||||||
|
Pivot Points |
||||||
|
Profit or loss in $ |
31,000 |
21,000 |
11,000 |
-9,000 |
-14,000 |
-19,000 |
|
Profit or loss in €2 |
27,173 |
18,408 |
9,642 |
-7,889 |
-12,272 |
-16,655 |
|
Profit or loss in £2 |
23,496 |
15,917 |
8,337 |
-6,822 |
-10,611 |
-14,401 |
|
Profit or loss in C$2 |
42,889 |
29,054 |
15,219 |
-12,452 |
-19,369 |
-26,287 |
- 1.00 lot is equivalent of 10,000 units
- Calculations for exchange rate used as of 14:00 (GMT+1) 31/07/2025
There is a possibility to use Stop-Loss and Take-Profit.
- You may wish to consider closing your position in profit, even if it is lower than suggested one.
- Trailing stop technique could protect the profit.