SILVER weekly special report based on 1.00 Lot Calculation:
US FEDERAL RESERVE:
- EVENT: WEDNESDAY, SEPTEMBER 17 AT 19:00 GMT+1: US FEDERAL RESERVE INTEREST RATE CUT DECISION. PRESS CONFERENCE (19:30 GMT+1). After some weaker-than-expected employment market data in July and August, markets are expecting an almost certain interest rate cut by the FED in September, with more cuts by the end of 2025. The benchmark interest rate currently stands at 4.5%, and according to market expectations, at least two more interest rate cuts could happen by the end of 2025.
MARKET EXPECTATIONS (WEDNESDAY, SEPTEMBER 17): US FEDERAL RESERVE IS EXPECTED TO ANNOUNCE ITS FIRST INTEREST RATE CUT SINCE DECEMBER 2024 TO BRING DOWN RATES FROM THE CURRENT 4.50% TO AT LEAST 4.25% (Source: https://www.cmegroup.com/markets/interest-rates/cme-fedwatch-tool.html)
MARKET EXPECTATIONS (AFTER WEDNESDAY, SEPTEMBER 17): US FEDERAL RESERVE IS EXPECTED TO ANNOUNCE MORE INTEREST RATE CUTS BY THE END OF 2025 TO BRING RATES DOWN TOWARDS 3.75% (Source: https://www.cmegroup.com/markets/interest-rates/cme-fedwatch-tool.html)
TABLE (MOST RECENT INTEREST RATE DECISIONS): US FEDERAL RESERVE INTEREST RATE POLICY SINCE JULY 2024
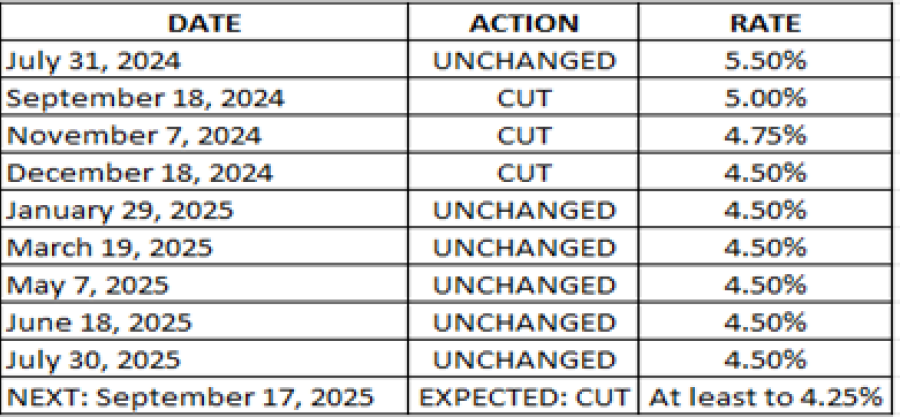
Data Source: Bloomberg Terminal; CMEGROUP.COM;
- STATISTICS (2000 - 2025): SILVER PRICE REACTION WITHIN 3, 6, 12 MONTHS AFTER THE FIRST RATE CUT BY THE FEDERAL RESERVE AS A NEW RATE CUT CYCLE BEGINS. Silver prices rose 2.62% on average within the first 3 months after the first rate cut of the cycle took place. Within the first 6 months, Silver prices rose 17.08% on average. Silver price rose nearly 20% on average within the first 12 months after the first cut.
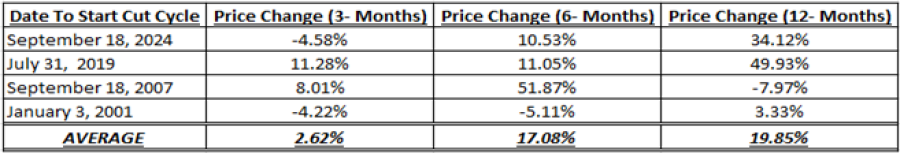
Date Source: Meta Trader 4
Please note that past performance does not guarantee future results
TECHNICAL ANALYSIS:
- PSYCHOLOGICAL SUPPORT: $40. After hitting fresh 14-year highs, silver prices have recently moved above the level of $40, which has now become their next psychological support. Silver was last trading slightly above $42.
- UPTREND SINCE APRIL 2025: After the March-April price pullback, silver prices have since been trading in an uptrend, as depicted by the daily chart below and the solid black uptrend line on the same chart. However, there remains a risk of a potential breakout below this level if market conditions change.
- ALL-TIME HIGH PRICE: $49.80. Silver jumped to $49.80 in 2011, during the debt crisis in Europe. Currently, Silver trades around $42.20, and if a full recovery is made, this could offer an upside potential of around 18%. However, the price could decline.
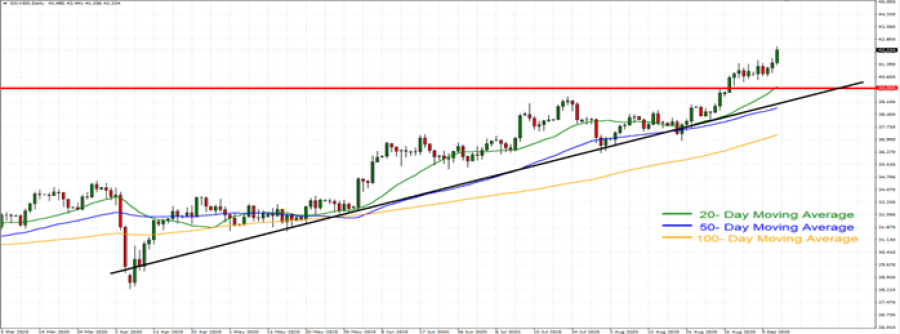
GRAPH (Daily): March 2025 – September 2025
Please note that past performance does not guarantee future results
SILVER, September 12, 2025.
Current Price: 42.20
|
SILVER |
Weekly |
|
Trend direction |
|
|
49.80 |
|
|
46.00 |
|
|
43.50 |
|
|
41.00 |
|
|
40.50 |
|
|
40.00 |
Example of calculation base on weekly trend direction for 1.00 Lot1
|
SILVER |
||||||
|
Pivot Points |
||||||
|
Profit or loss in $ |
76,000 |
38,000 |
13,000 |
-12,000 |
-17,000 |
-22,000 |
|
Profit or loss in €2 |
64,844 |
32,422 |
11,092 |
-10,239 |
-14,505 |
-18,771 |
|
Profit or loss in £2 |
56,142 |
28,071 |
9,603 |
-8,865 |
-12,558 |
-16,252 |
|
Profit or loss in C$2 |
105,184 |
52,592 |
17,992 |
-16,608 |
-23,528 |
-30,448 |
- 1.00 lot is equivalent of 10,000 units
- Calculations for exchange rate used as of 10:20 (GMT+1) 12/9/2025
There is a possibility to use Stop-Loss and Take-Profit.
- You may wish to consider closing your position in profit, even if it is lower than suggested one.
- Trailing stop technique could protect the profit.