Special Report: USA100
Date: July 11, 2023
WEEKLY TREND: UP
US STOCK MARKETS
- STOCK MARKET TREND DEFINITION
BEAR MARKET: DEFINITION. According to Forbes, economists define a bear market as a decline of 20% or more of a major stock market index, such as the NASDAQ 100, for a sustained period. SENTIMENT: During a bear market, market sentiment is poor. Investors are pessimistic about the stock market’s prospects, making them more likely to sell assets than hold them.
BULL MARKET: DEFINITION. While bear markets signal a time of pessimism and economic decline, a bull market is defined by optimism and economic growth. A bull market is a period when stock prices are rising and investor sentiment is positive. During a bull market, stocks in a broad market index increase in value by 20% or more from recent bottom. According to First Trust, the average bull market period lasted 6.6 years with an average cumulative total return of 339%.
Table I: Bear and Bull Market Characteristics
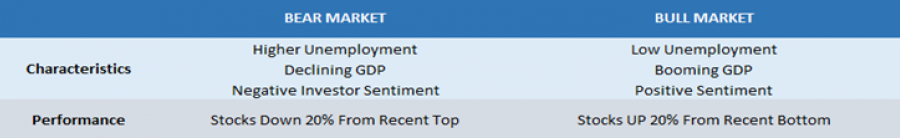
Data Source: Forbes
USA100 INDEX
- THE USA100 INDEX: TRANSITION FROM BEAR TO BULL MARKET
BEAR MARKET CONFIRMED in April, 2022. The Index fell 20% from 16,765.87 (November 21, 2021) to 13,412.70 (April 22, 2022). The market was there for 11- 12 months, having a maximum drop of 37.46% (October 13, 2022).
BEAR MARKET BOTTOM: October 13, 2022. The Index fell to 10,484.68 by October 13, 2022, marking a total decline of 37.46% from its recent top of 16,765.87 (November 21, 2021).
INDEX HAS RISEN MORE THAN 20% FROM RECENT BOTTOM TO ENTER A NEW BULL MARKET (5 Months): March 16, 2023. The index currently trades around 15,140, which is up by around 44% since the October 2022 bottom. If a full recovery followed to its recent all-time high, this could be an upside of additional 11%. However, it could also decline further.
- MOST RECENT RECOVERY FOLLOWING A BEAR MARKET (USA100):
2020 (COVID PANDEMIC DECLINE): After the pandemic decline of 32%, testing the rate of 6,615.50 (March 22, 2020), the index had risen around 153% to its most recent all time high of 16,765.87 (November 21, 2021).
2007- 2008 (GLOBAL FINANCIAL CRISIS): After a decline of around 55%, testing the rate of 1,017.80 (November 16, 2008), the index trended up in a strong bull run to add around 860% until the Covid Pandemic Crisis (February 16, 2020 to reach the level of 9,762).
However, please note that past performance does not guarantee future results.
- NEXT EVENTS
US INFLATION (JULY 12 AT 13:30 GMT+1): INFLATION IS EXPECTED TO FALL IN JUNE TO 3.1% FROM MAY’S 4.0%. The US Inflation is currently down from 9.1% in summer 2022, to May’s 4.00%, the lowest since May 2021.
US Q2 EARNINGS SEASON STARTS (JULY 14): Tech giants such as Apple, Alphabet, Microsoft, Tesla, Amazon will all report Q2 earnings in late July and early August.
US FEDERAL RESERVE INTEREST RATE DECISION (JULY 26 AT 19:00 GMT+1): THE US FED IS EXPECTED TO RAISE THE BENCKHMARK INTEREST RATE TO 5.50% FROM CURRENT 5.25%. However, the markets have recently increased expectations that after the July meeting the US Fed may no longer raise interest rates.
USA100, July 11, 2023
Current Price:15,140
|
USA100 |
Weekly |
|
Trend direction |
|
|
16,766 |
|
|
16,350 |
|
|
15,900 |
|
|
14,400 |
|
|
14,200 |
|
|
14,000 |
Example of calculation based on weekly trend direction for 1 Lot1
|
USA100 |
||||||
|
Pivot Points |
||||||
|
Profit or loss in $ |
16,260 |
12,100 |
7,600 |
-7,400 |
-9,400 |
-11,400 |
|
Profit or loss in €2 |
14,772 |
10,993 |
6,905 |
-6,723 |
-8,540 |
-10,357 |
|
Profit or loss in £2 |
12,632 |
9,400 |
5,904 |
-5,749 |
-7,303 |
-8,856 |
|
Profit or loss in C$2 |
21,576 |
16,056 |
10,085 |
-9,819 |
-12,473 |
-15,127 |
1. 1.00 lot is equivalent of 10 units
2. Calculations for exchange rate used as of 10:15 (GMT+1) 11/07/2023
Fortrade recommends the use of Stop-Loss and Take-Profit, please speak to your Senior Account ManagerClient Manager regarding their use.
- You may wish to consider closing your position in profit, even if it is lower than suggested one
- Trailing stop technique can protect the profit – Ask your Senior Account ManagerClient Manager for more detail